The Main Screen
The lower section of the Home Page – the Main Screen – is divided into five [5] separate Areas. They’re identified below as follows:
| Area 1 | Area 2 | Area 3 | Area 4 | Area 5 |
| Flight Activity | World Map | Recently-Completed Flights | Top Pilots | Historical Performance |
Area 1 – Flight Activity
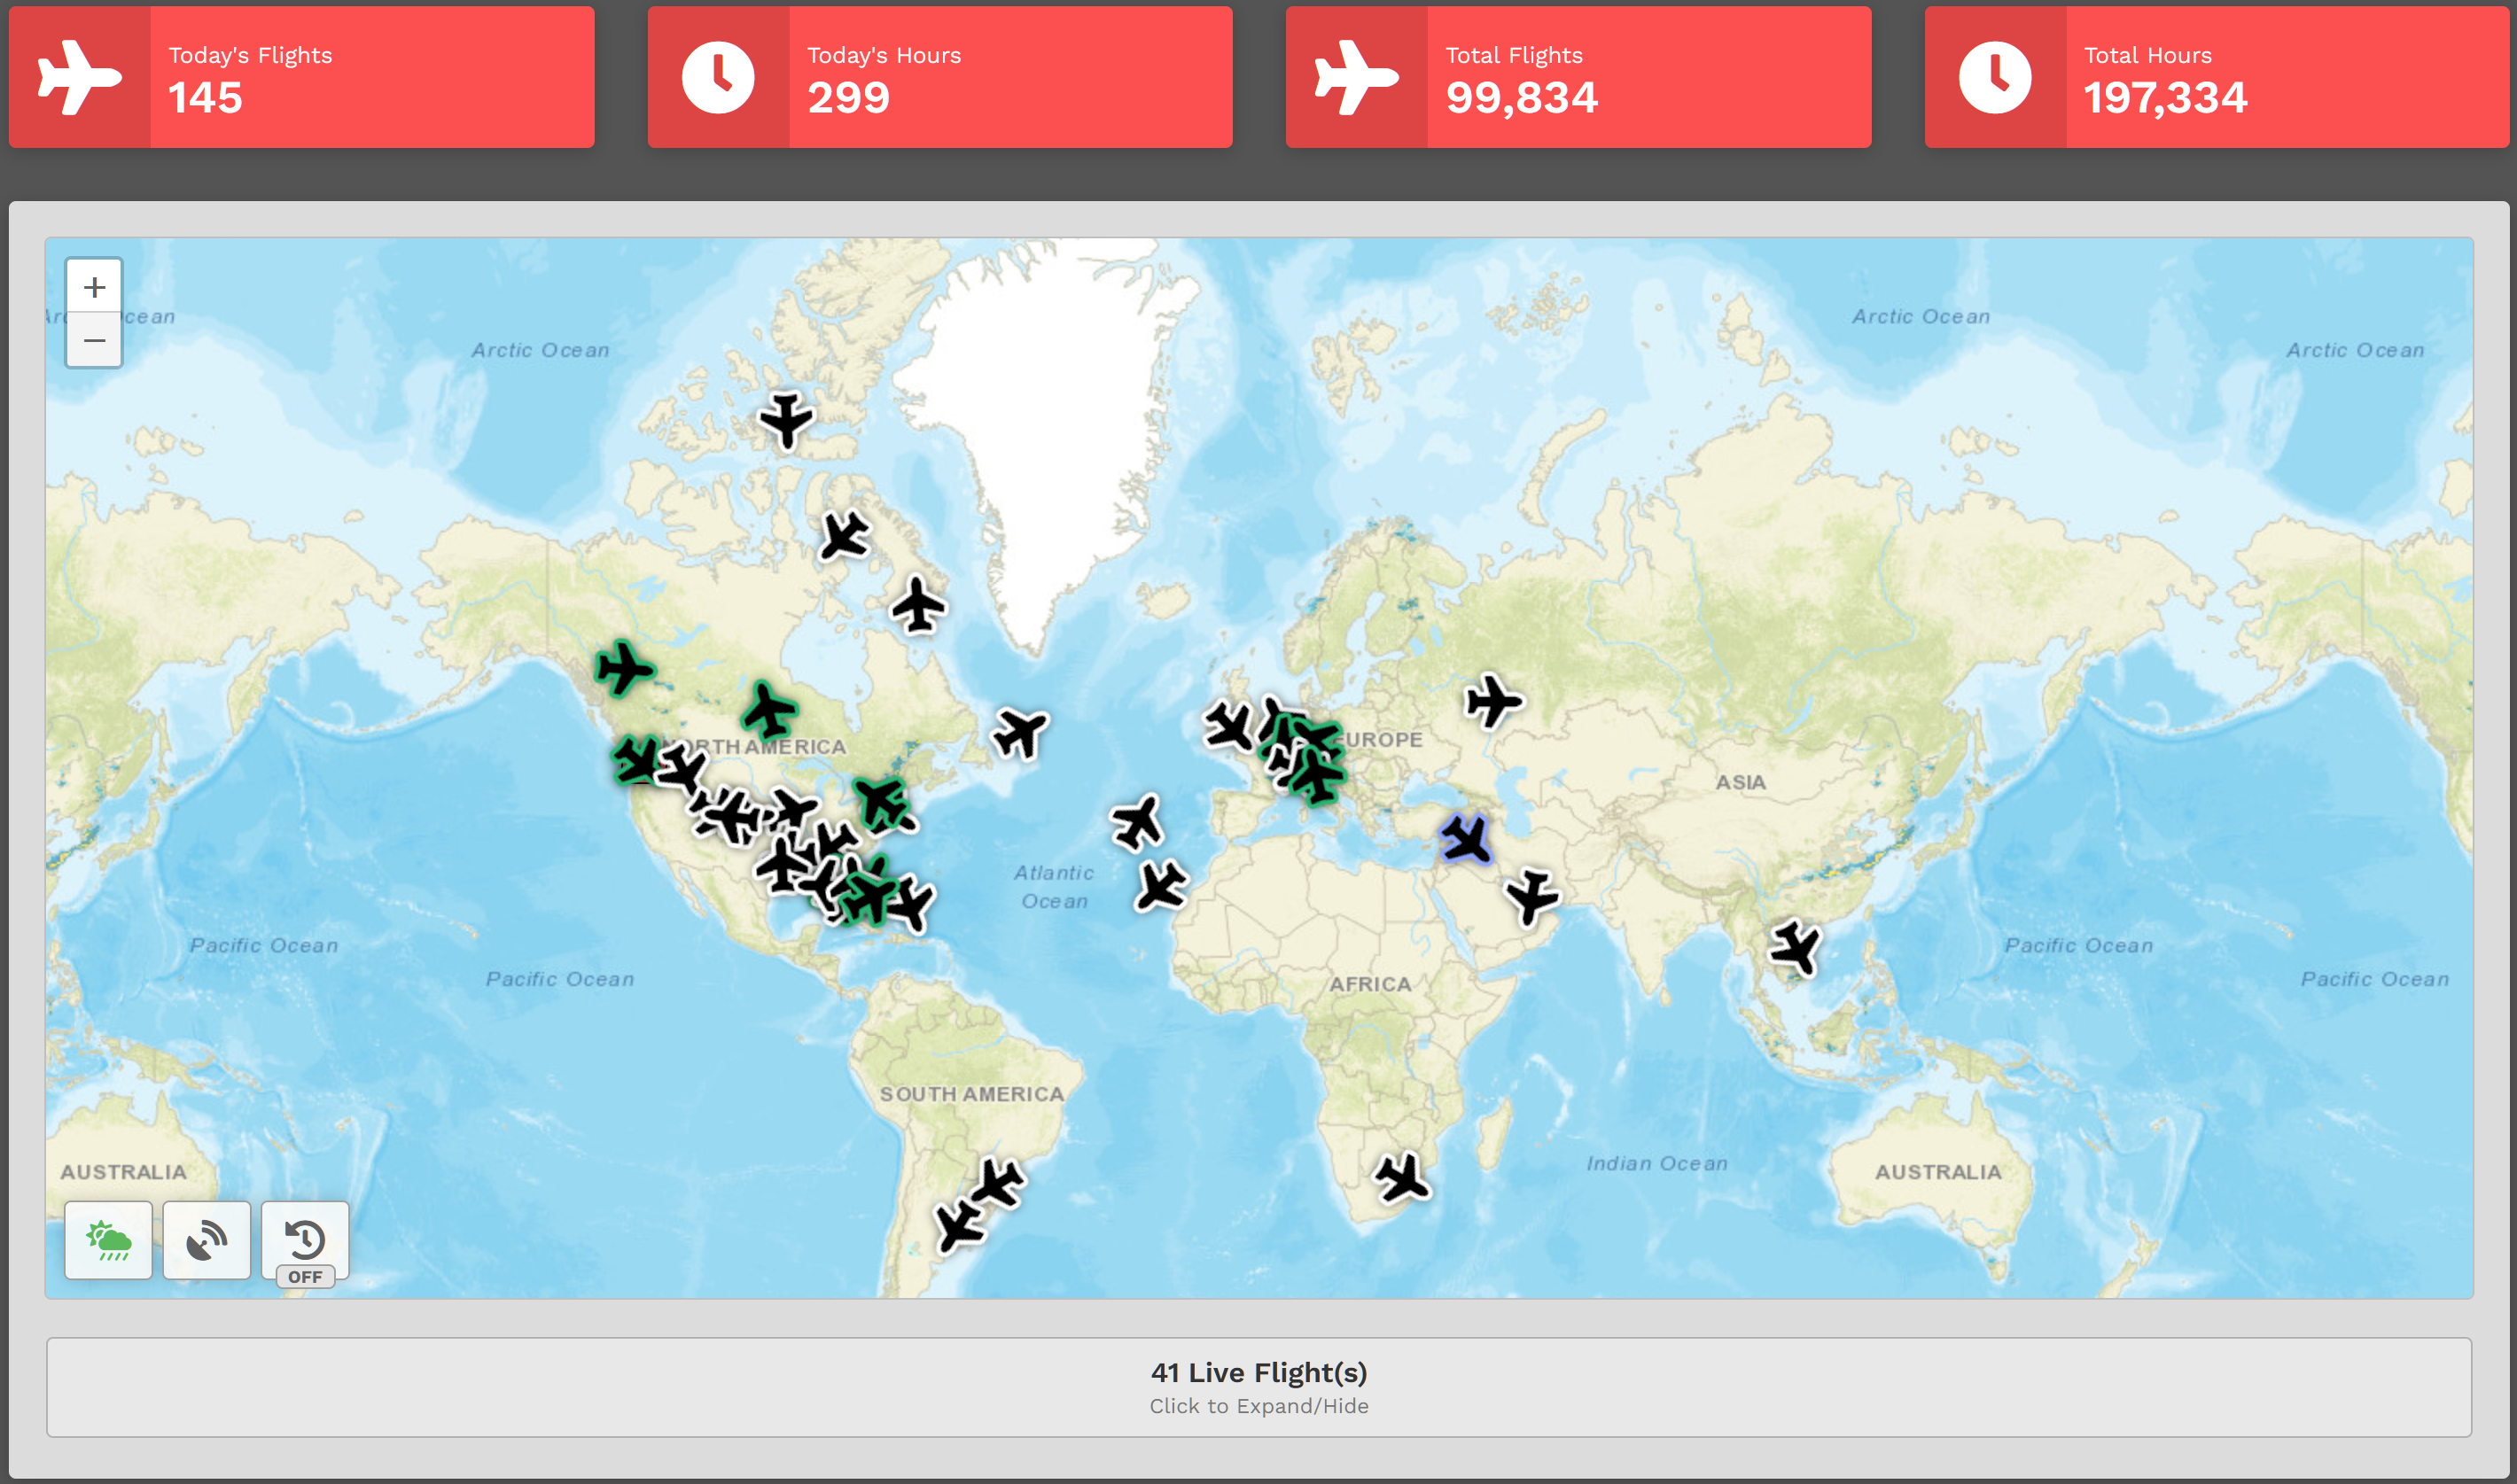
Area 1 displays information related to the Company’s Flight Activity. These figures are updated in real time throughout the day.
| Today's Hours | The number of flight hours completed by Company Pilots on the current date. |
| Today's Flights | The number of flights completed by Company Pilots on the current date. |
| Total Hours | The total number of hours flown by Company Pilots since January 2020. |
| Total Flights | The total number of flights completed by company Pilots since January 2020. |
Universal Coordinated Time (UTC), a successor to Greenwich Mean Time (GMT), is the time standard used in our System.
A new day begins at 00:00:00 UTC and ends at 23:59:59 UTC.
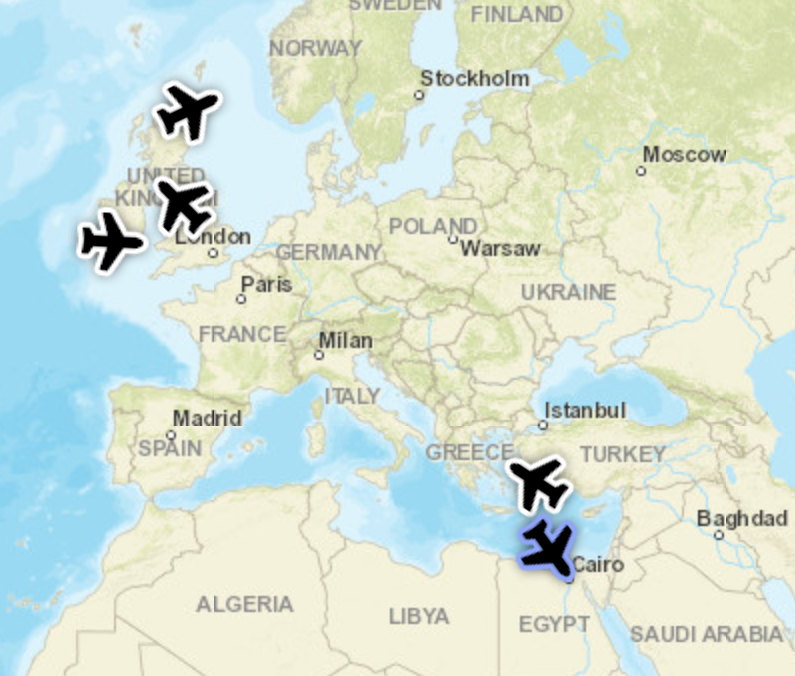
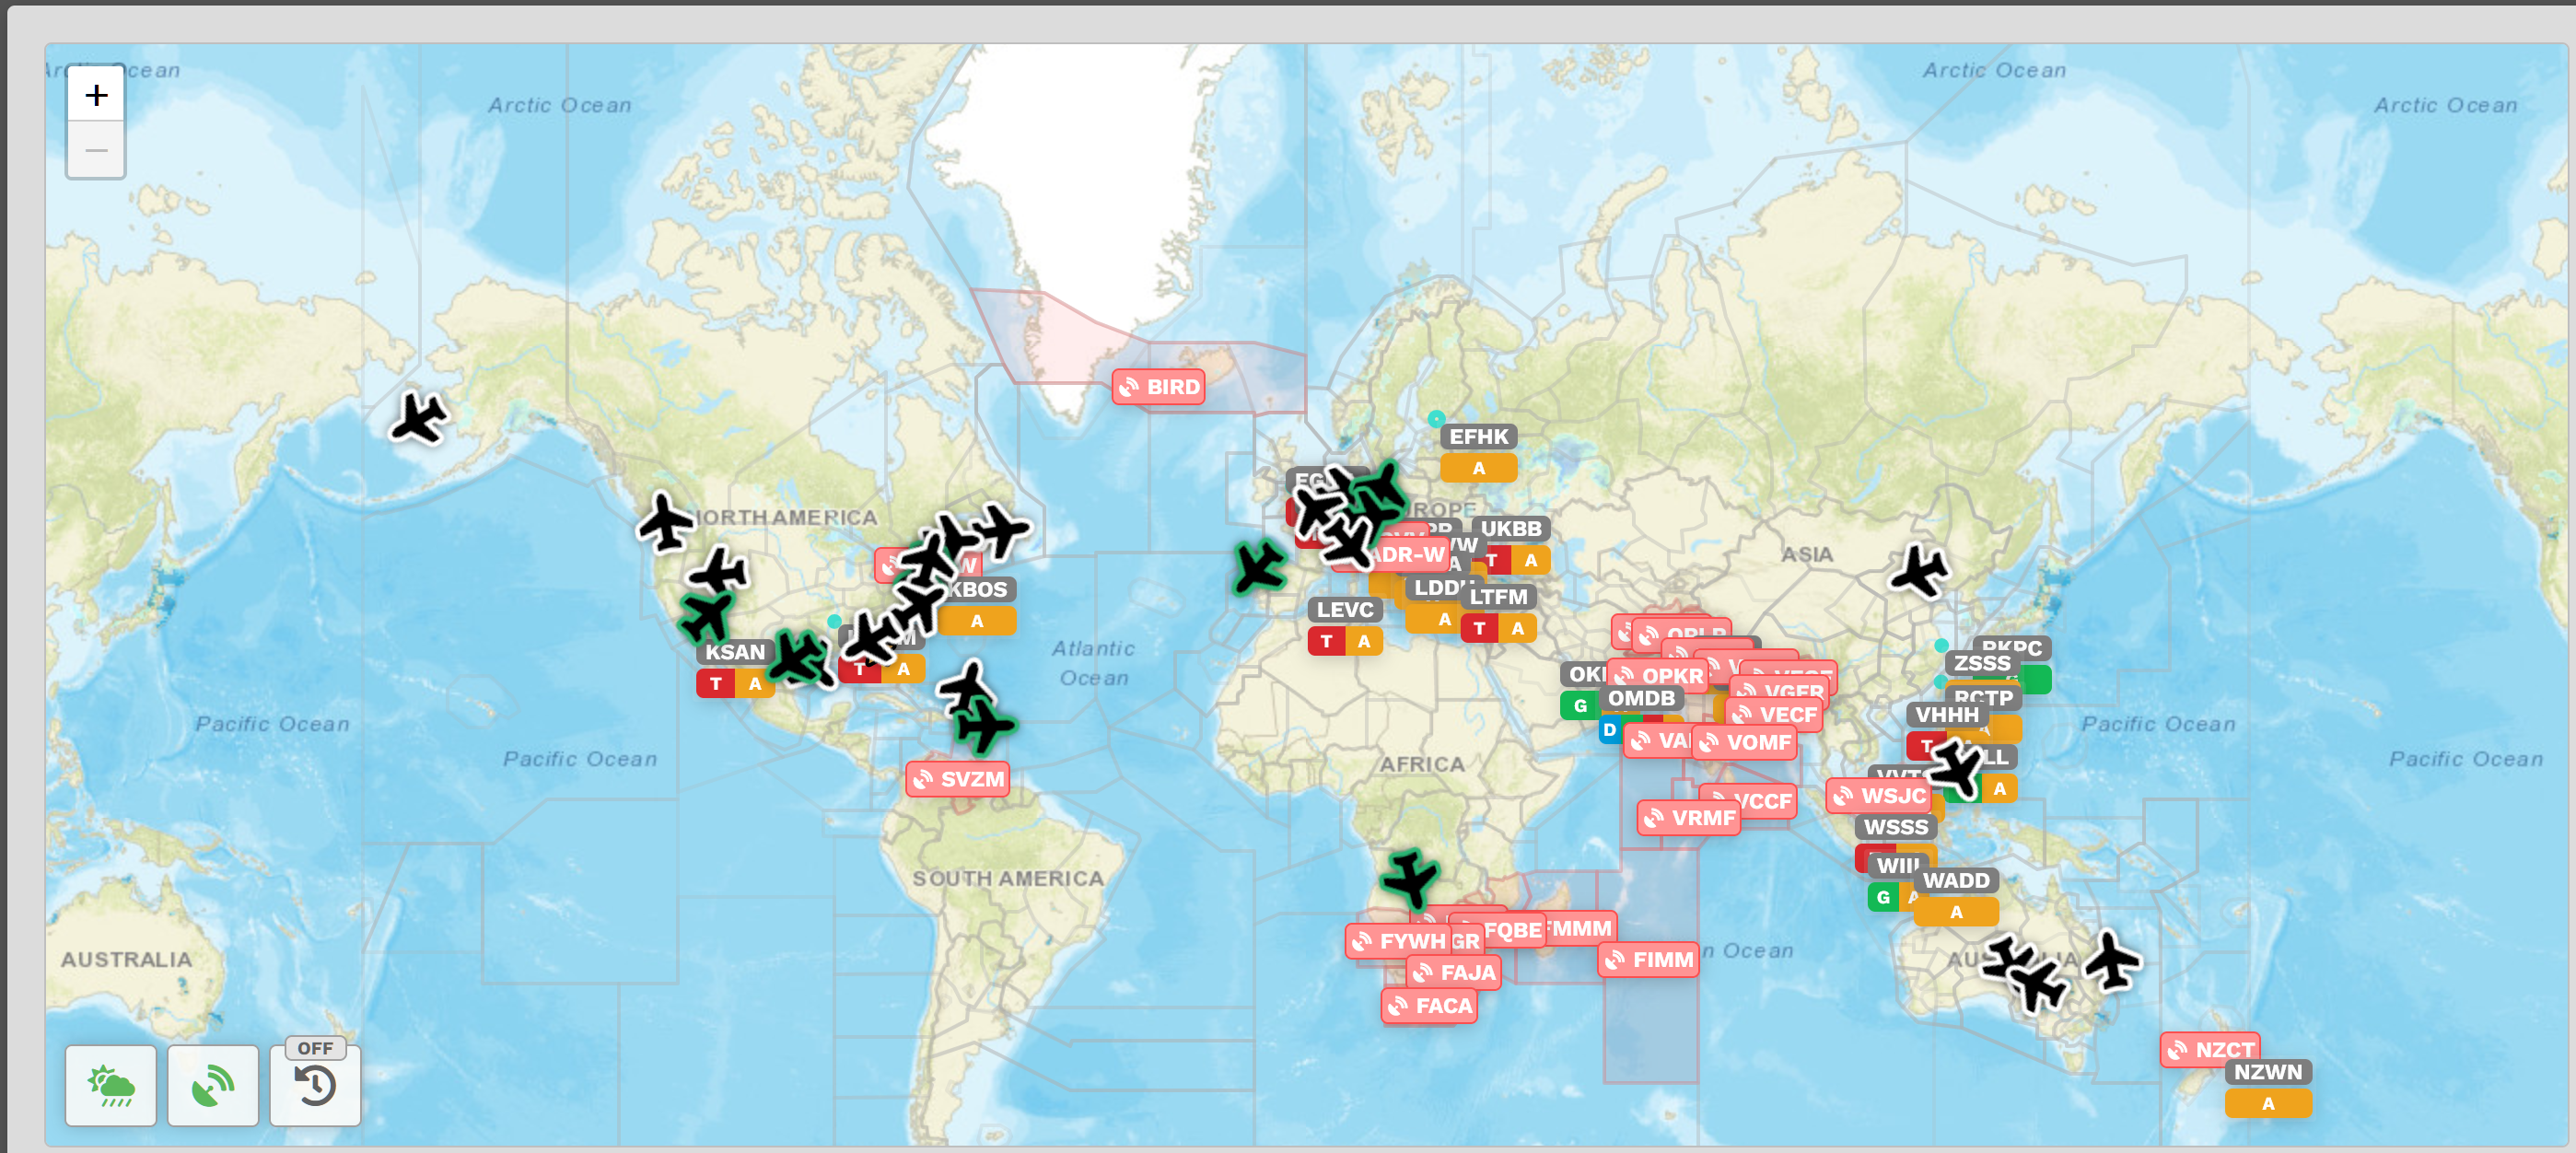
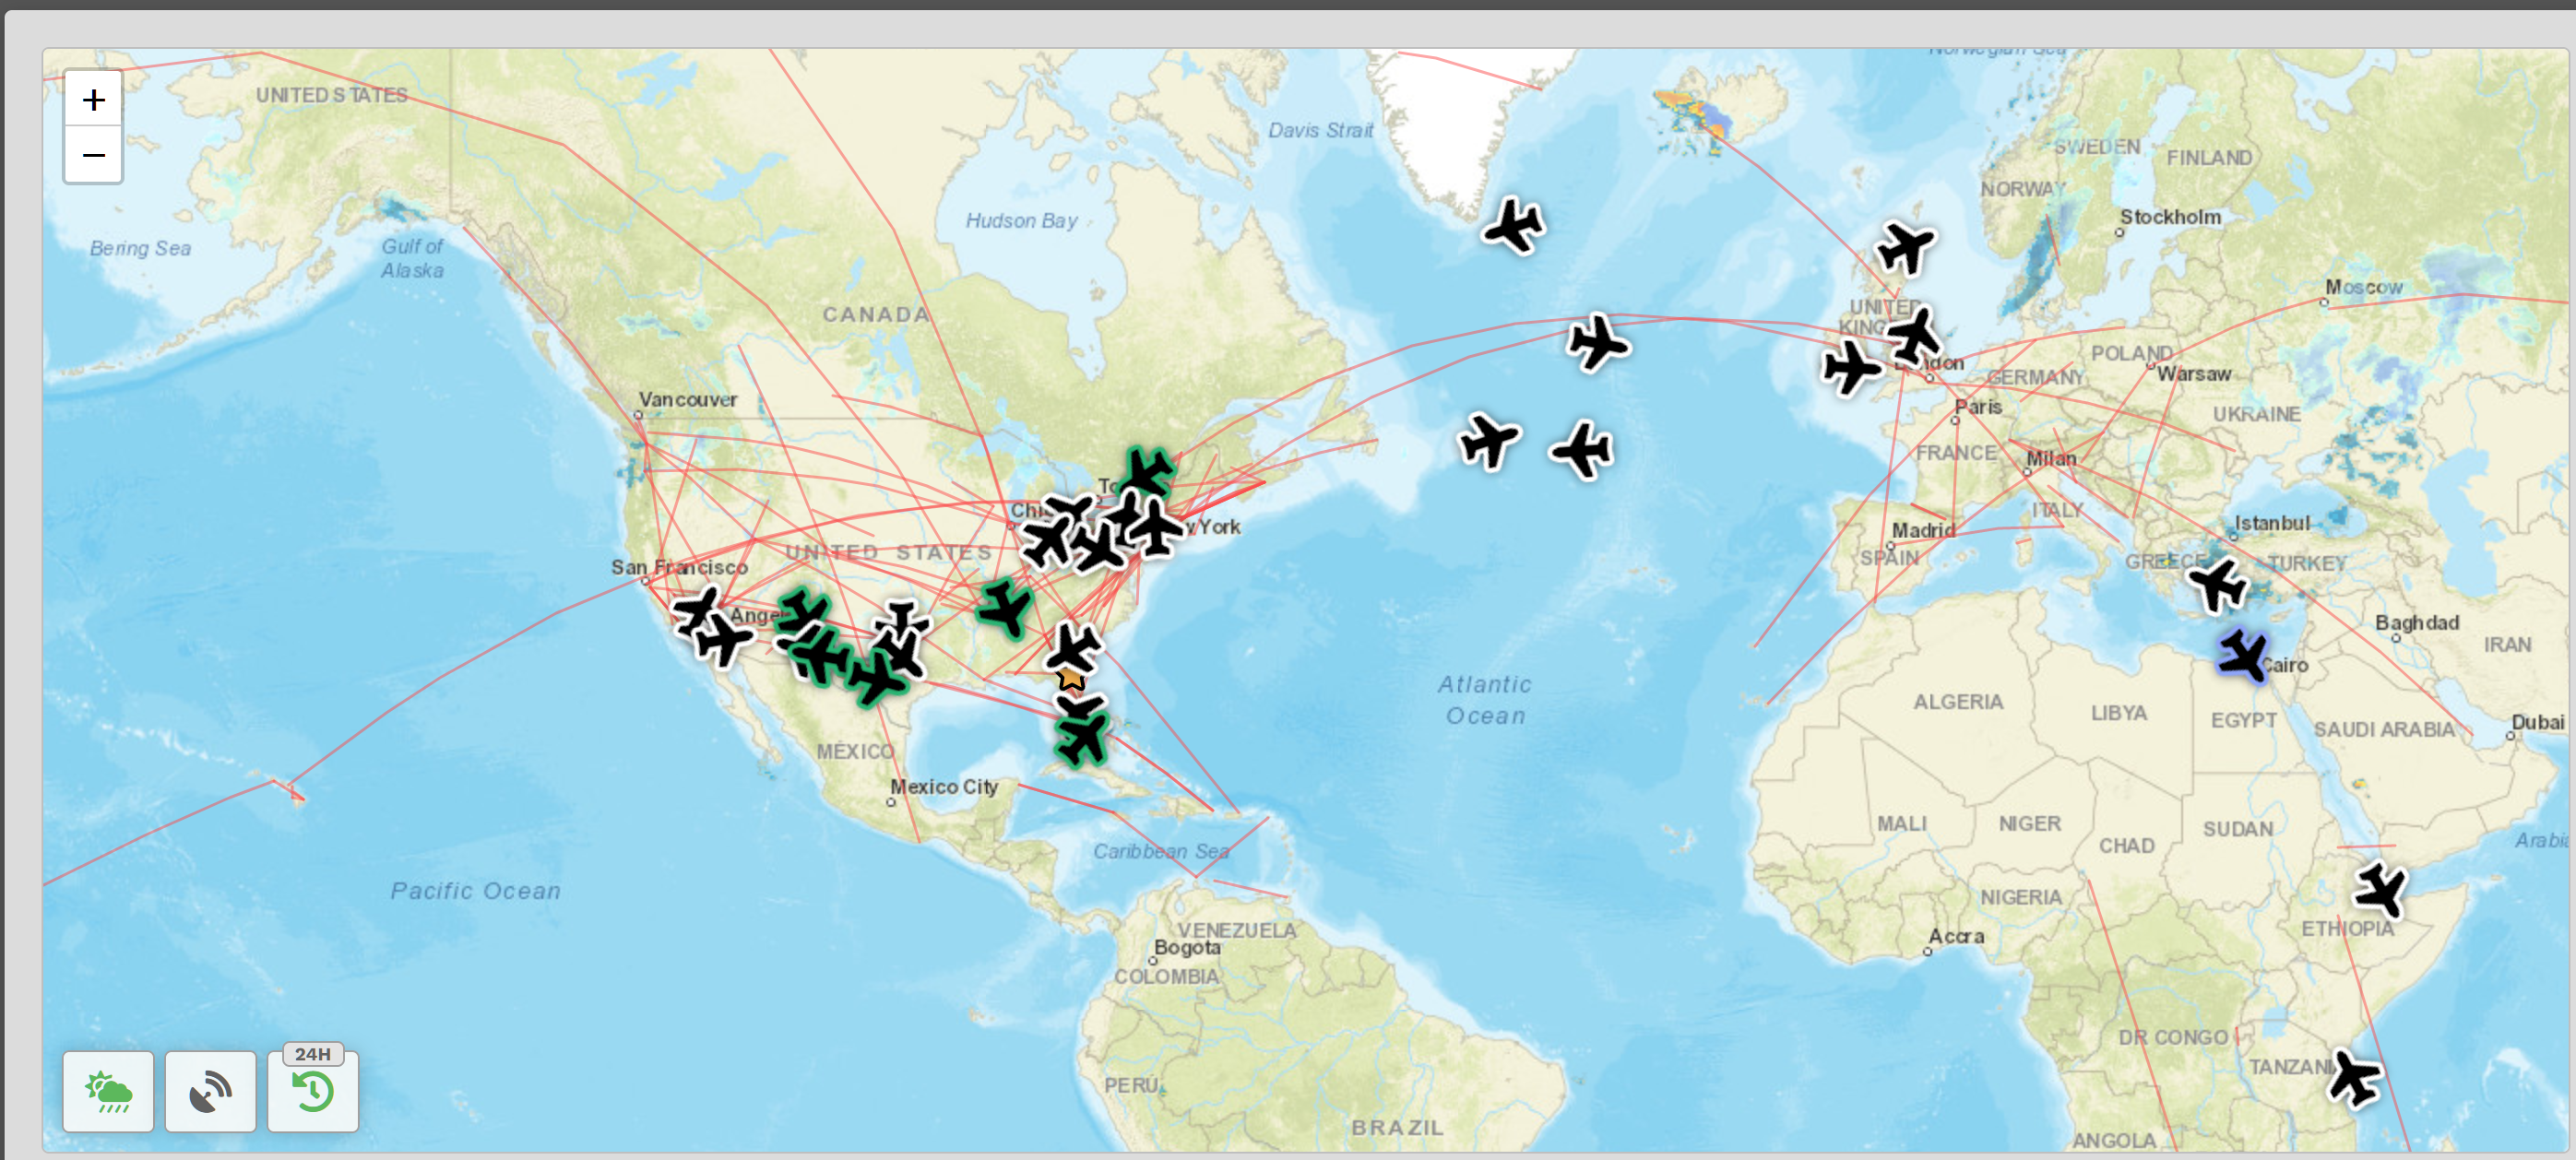
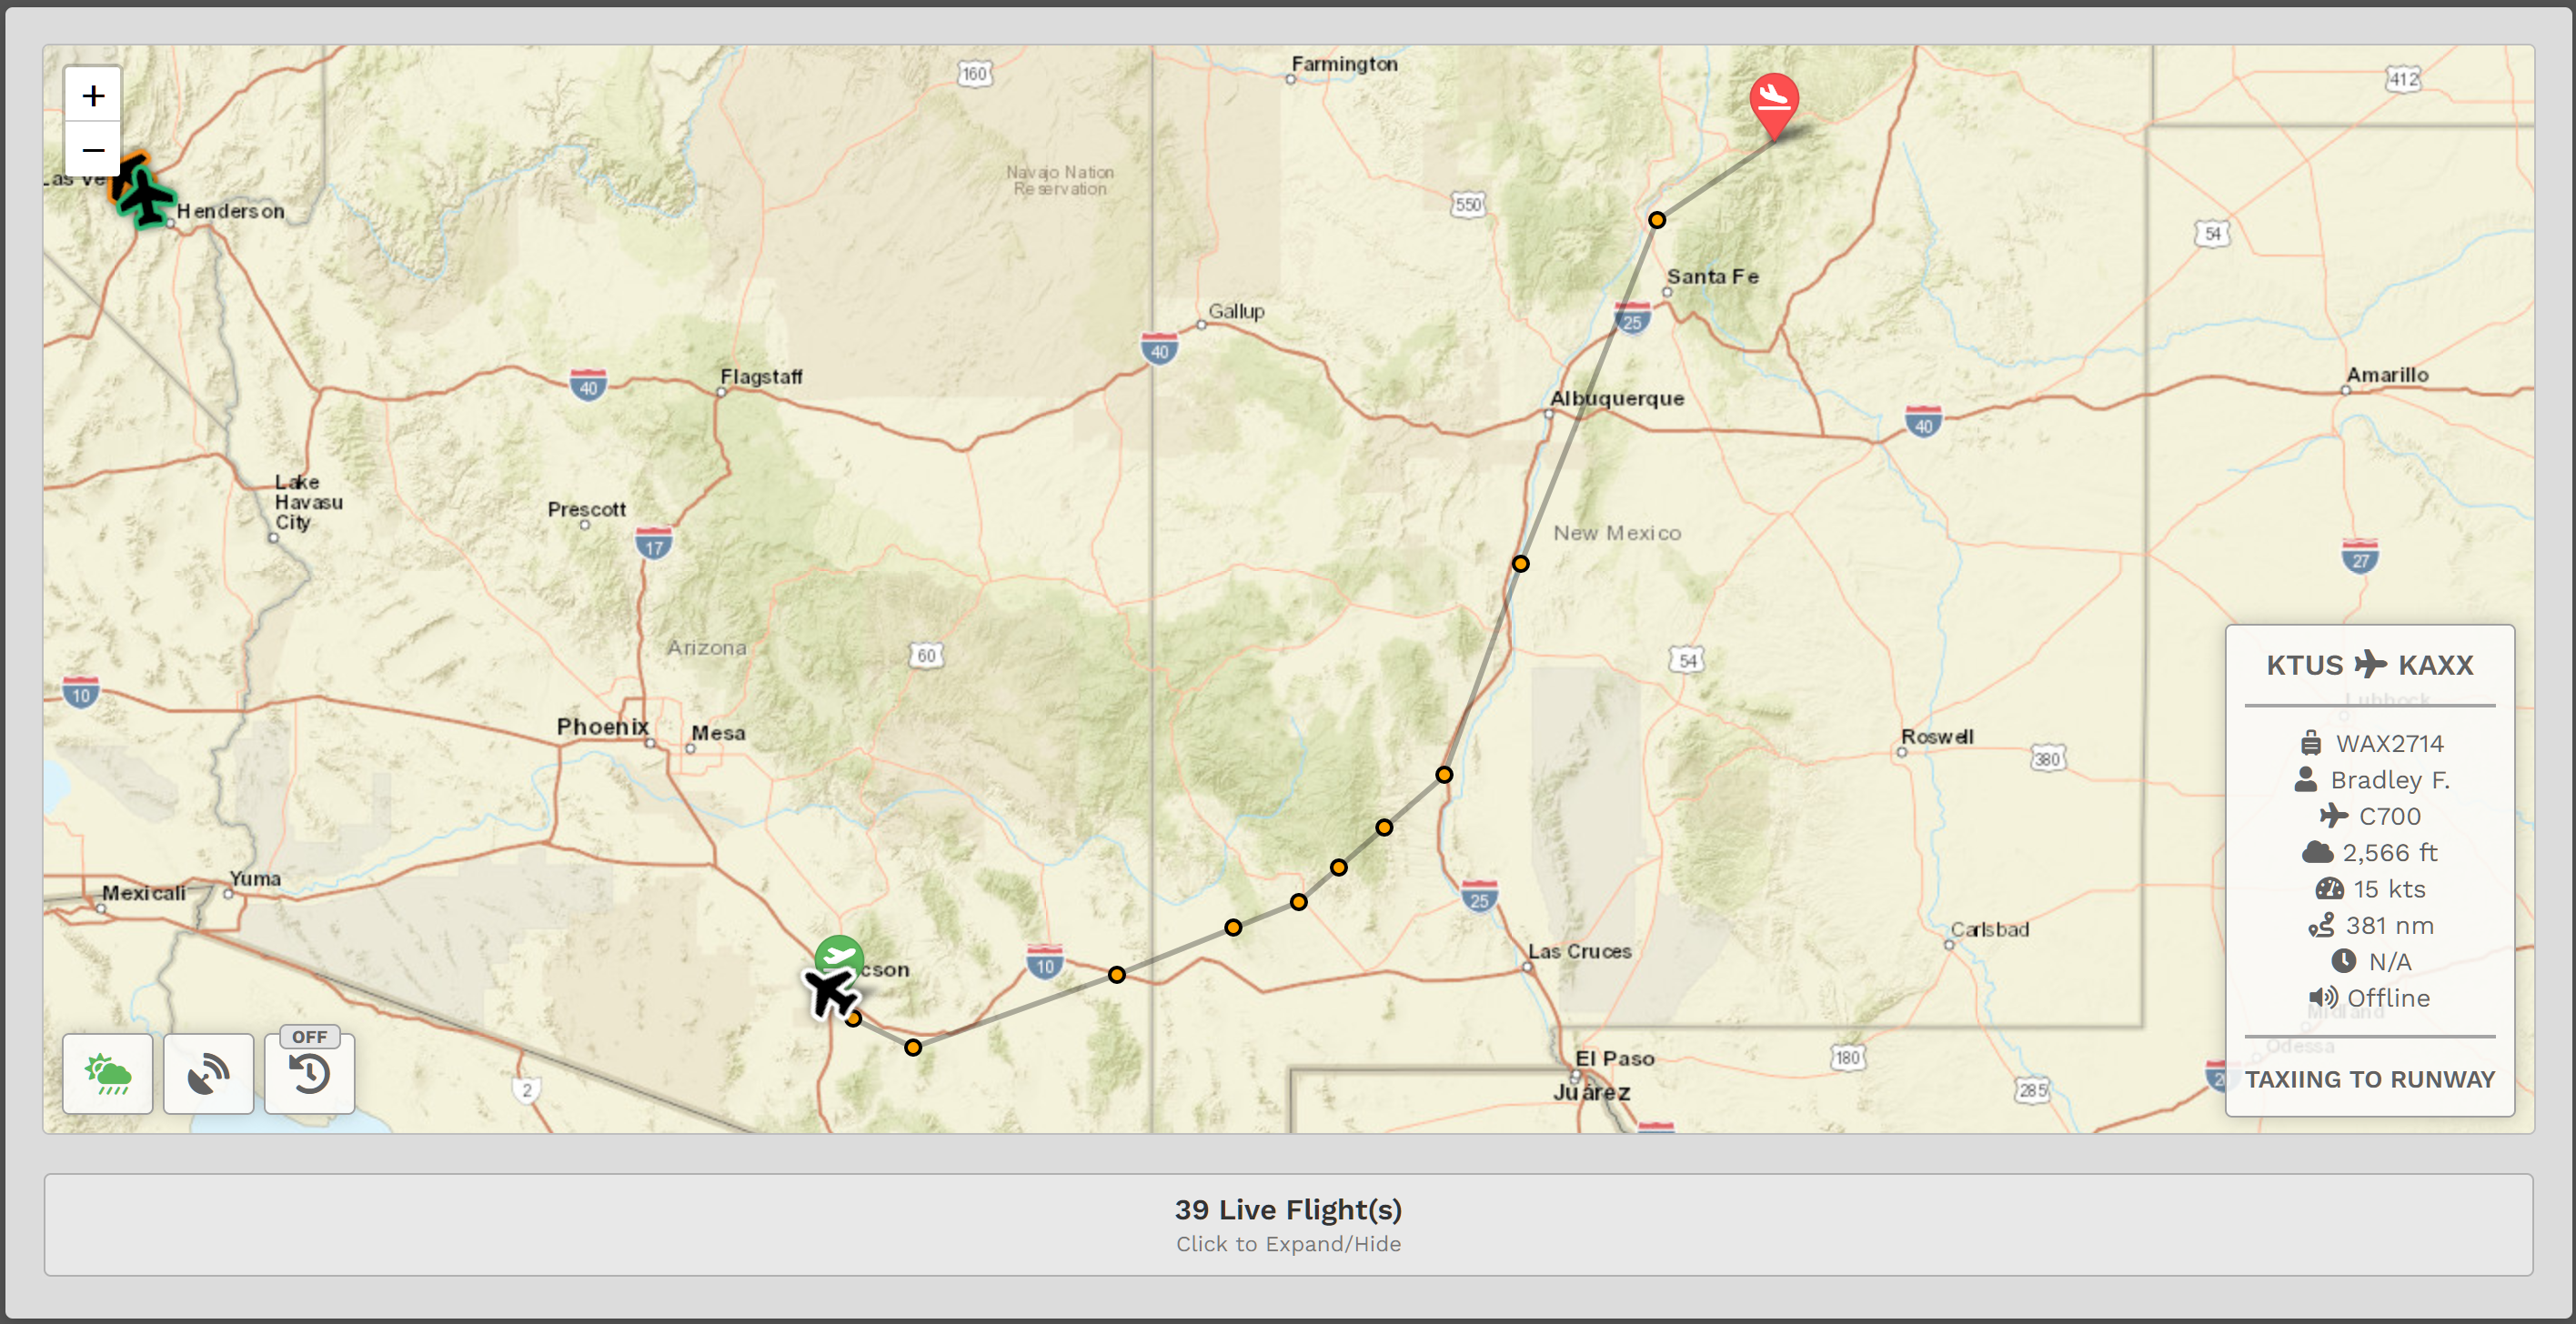
Area 2 – World Map
Area 2 displays a world map showing all flights currently being flown by company Pilots.
The border/outline color of an aircraft's icon indicates its current ATC Network status – as illustrated below.
If you want your flights to reflect your ATC network status, you must add your Network ID(s) to your profile. If you do not, your flights and PIREPS will all be listed as "offline." Click here to read on how to set this up.
| Offline | IVAO | PilotEdge | VATSIM |
|
|
|
|
|


Click Live Flights and the screen below will appear. Click it again and the screen will disappear.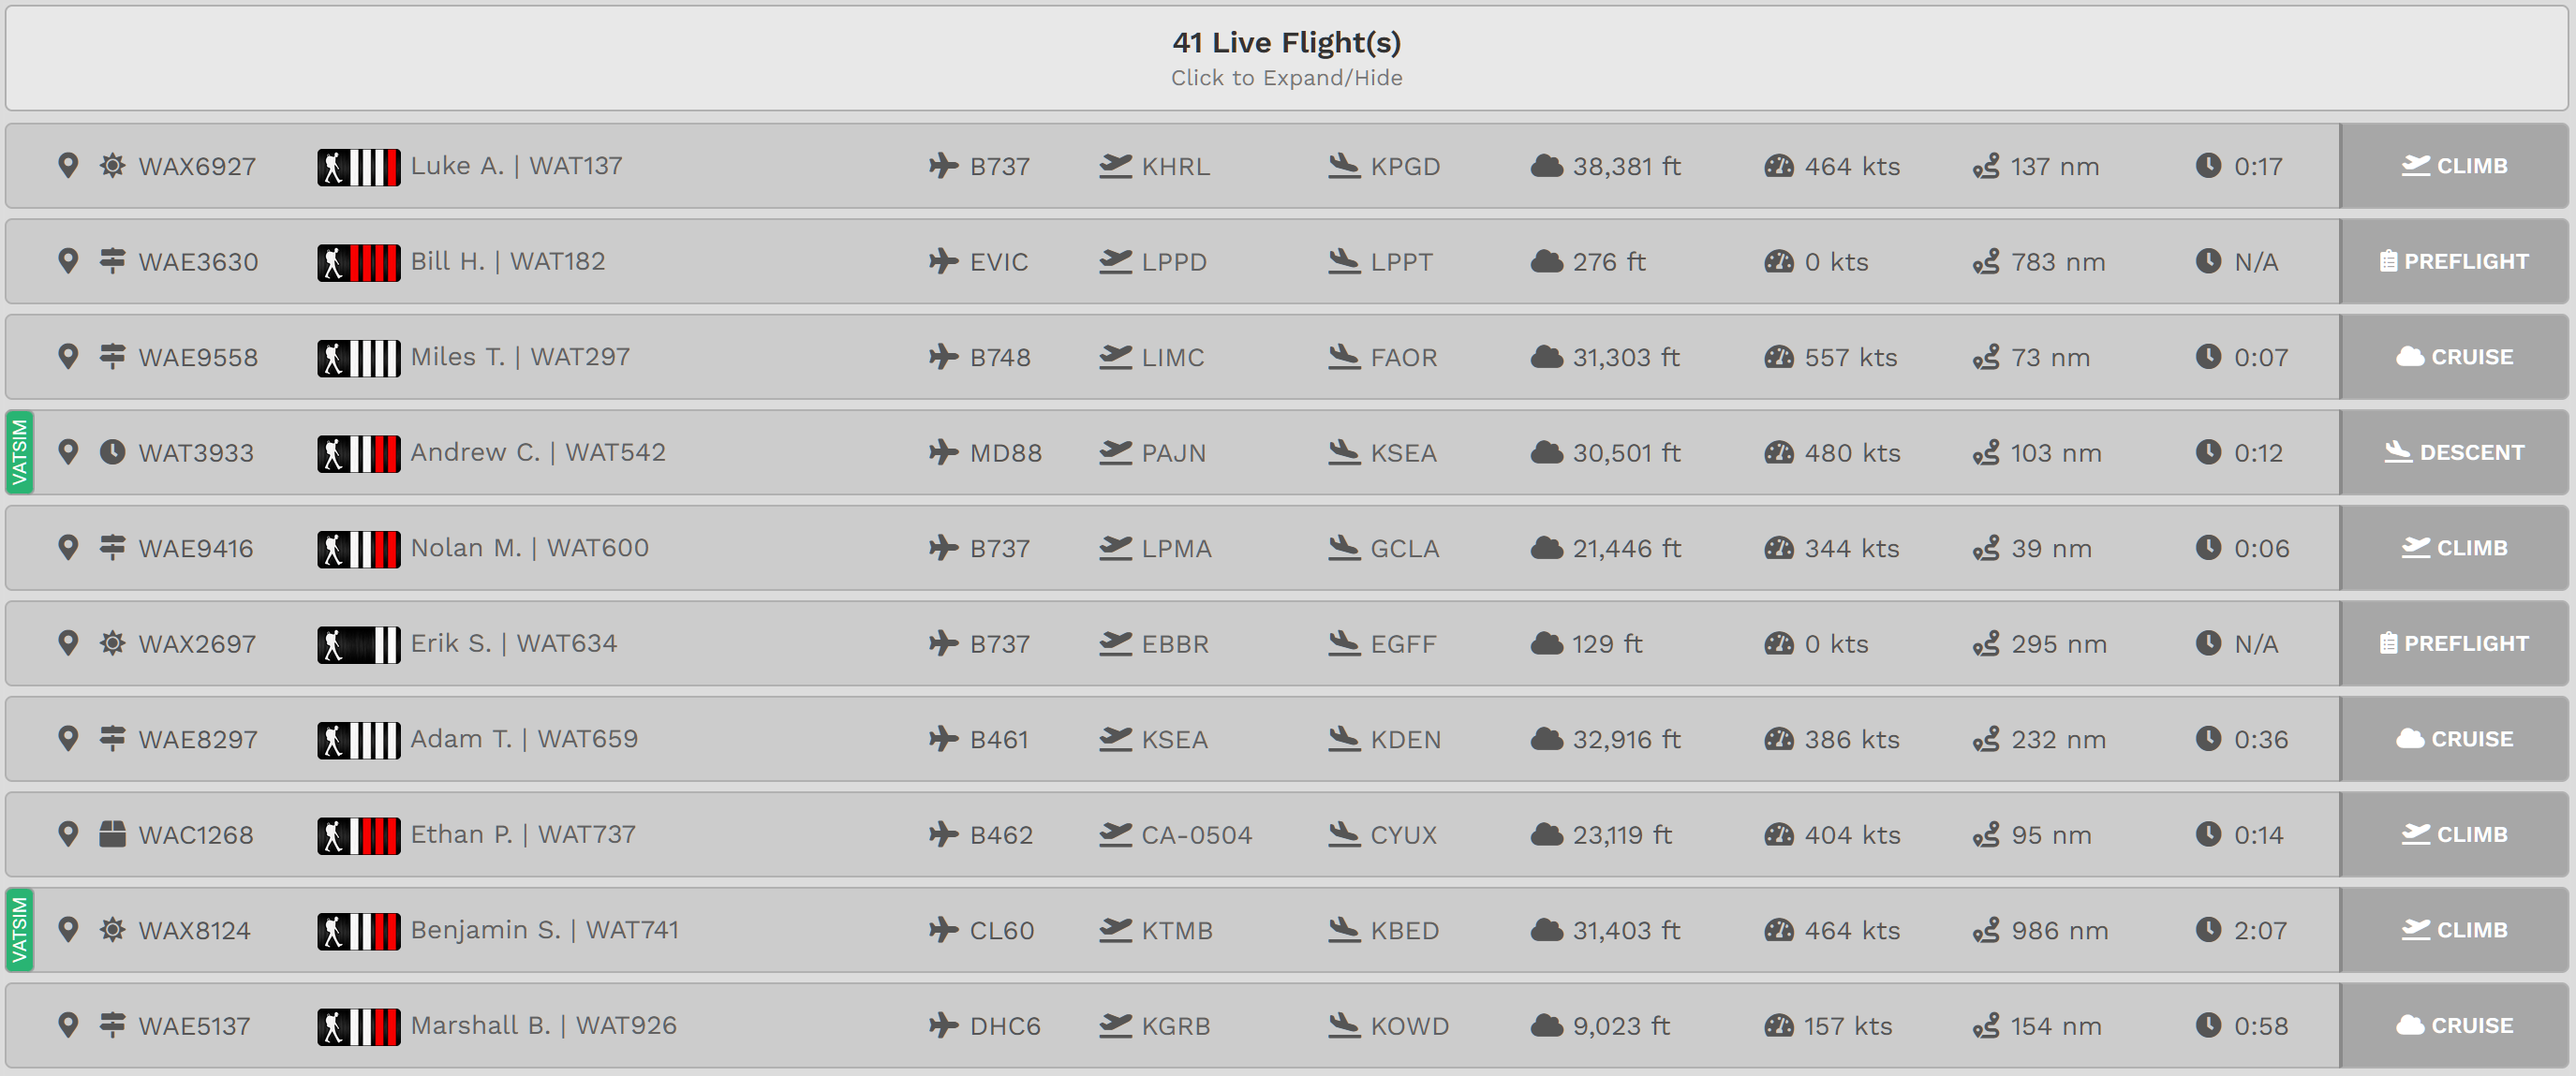
Once Live Flights is expanded, the status of each flight can be seen in detail.
Clicking on a Pilot’s name in that area will take you to their Pilot Profile.
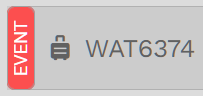
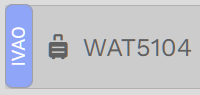
For some flights, you may notice a colored bar on the far left of its line entry. Their meanings are as follows:
| This flight is being/was flown as part of an Event. | This flight is being/was flown on the IVAO ATC Network. | This flight is being/was flown on the PilotEdge ATC Network. | This flight is being/was flown on the VATSIM ATC Network. |
 |
 |
 |
 |
If you want your flights to reflect your ATC network status, you must add your Network ID(s) to your profile. If you do not, your flights and PIREPS will all be listed as "offline." Click here to read on how to set this up.
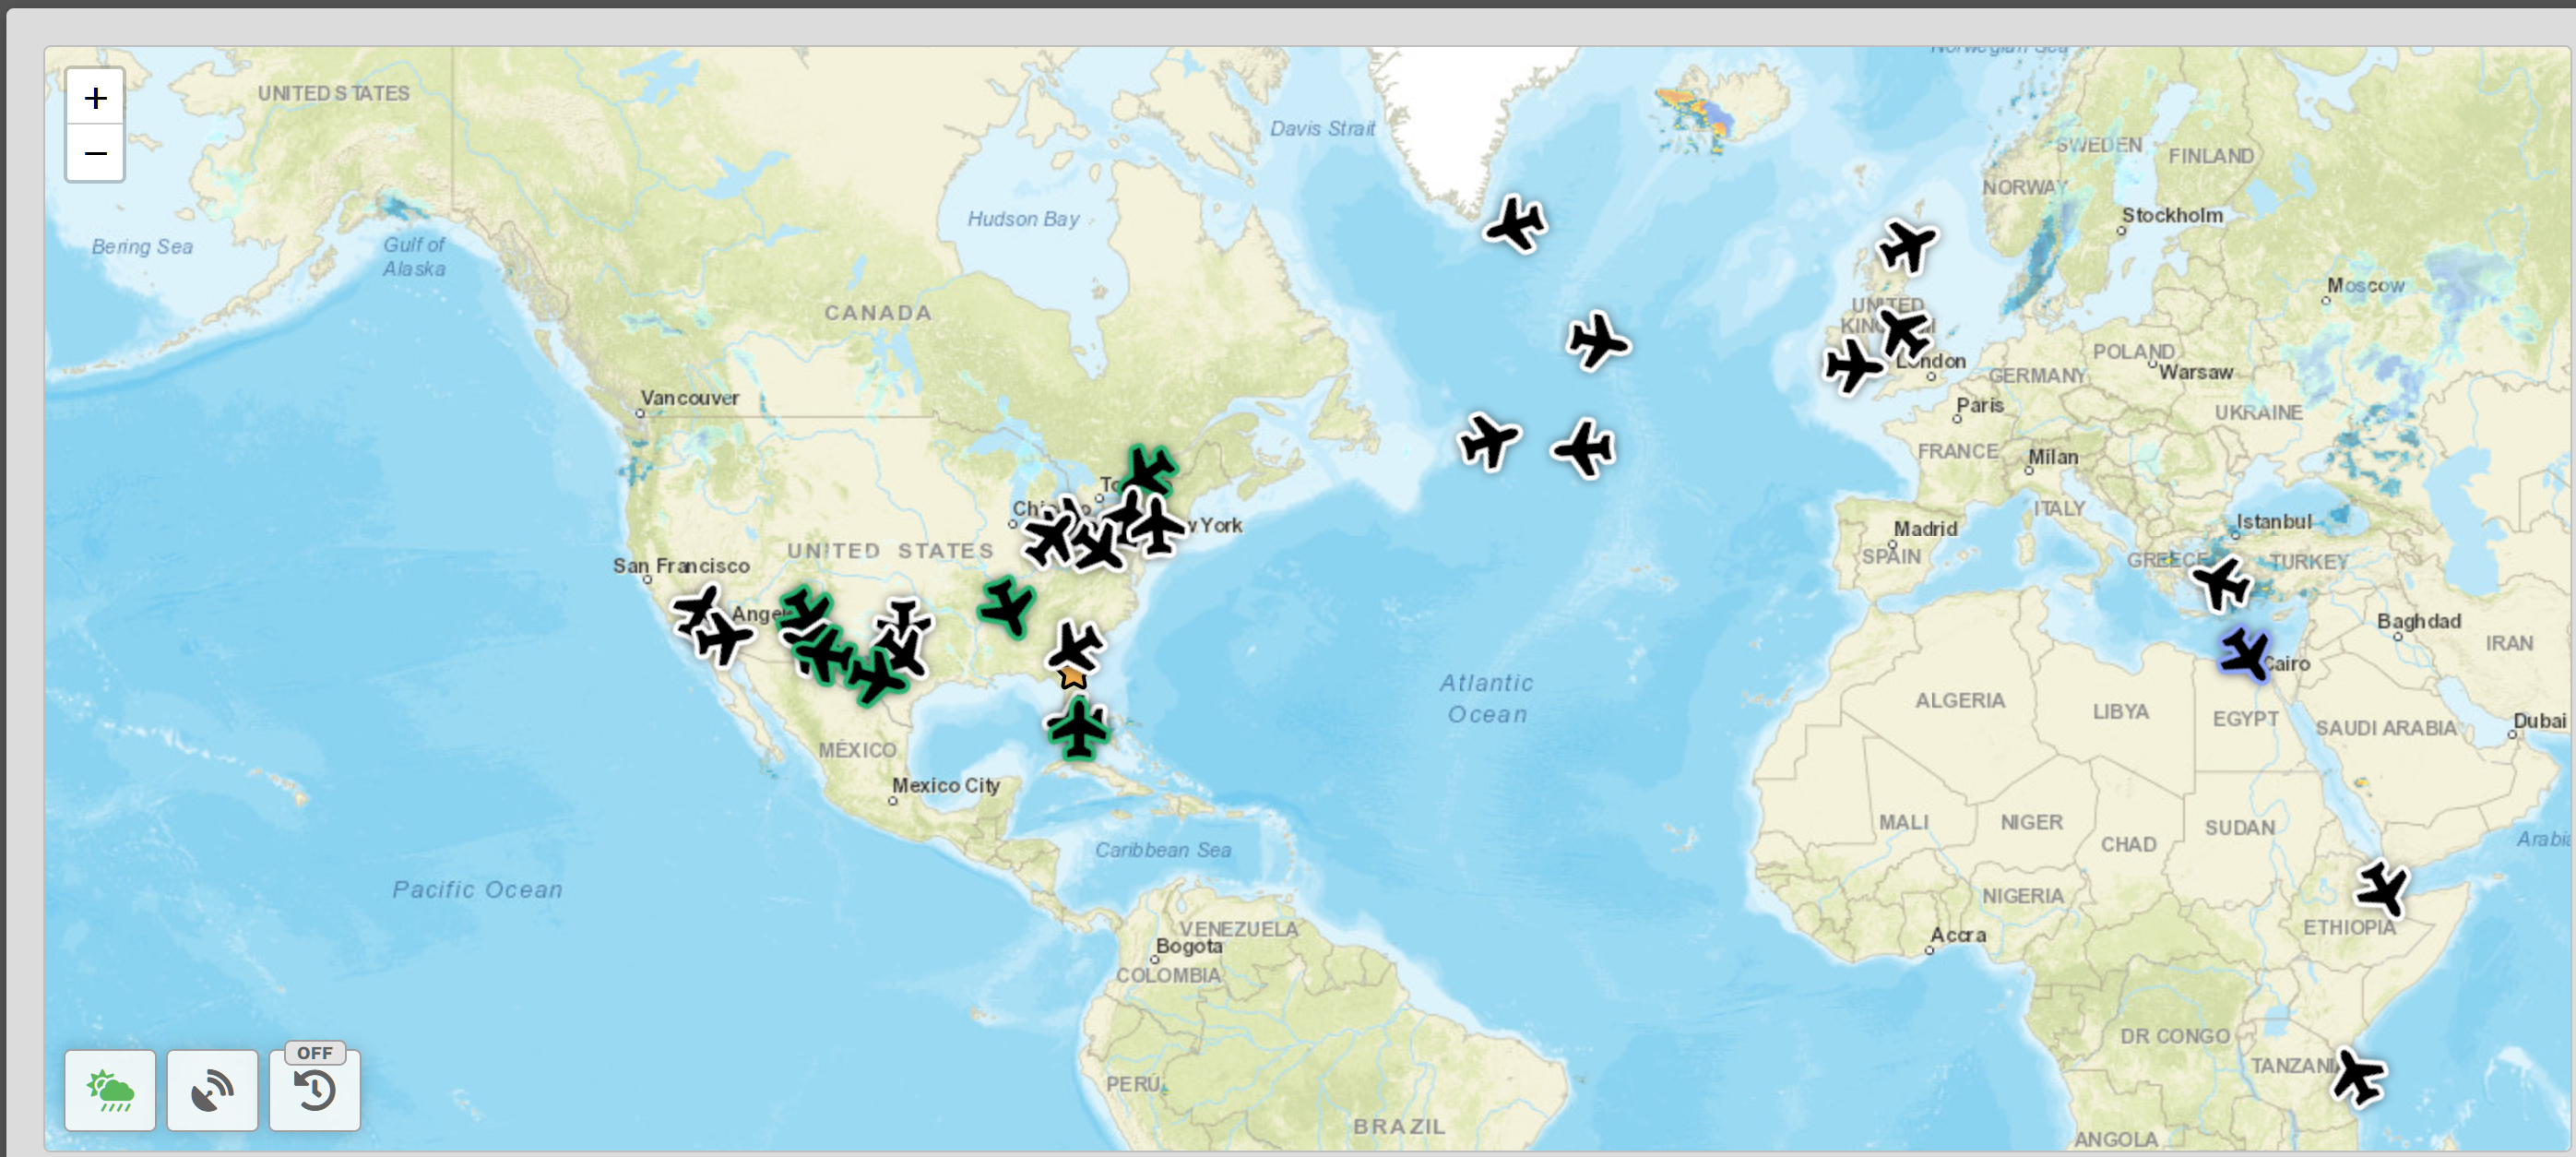
There are three (3) buttons in the lower left corner of the map. Clicking on them will change the information actively displayed.
 |
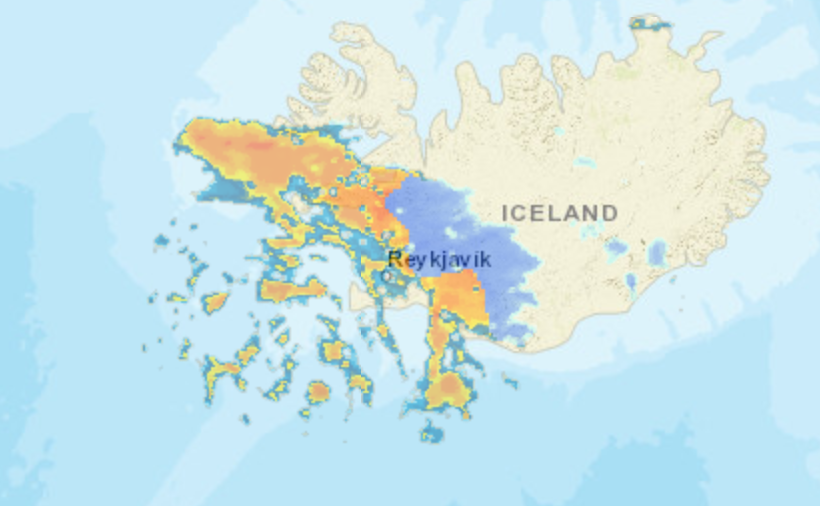
Clicking this button will display the weather. NOTE: When this feature is activated, the button will be green.
|
||||||||||
 |
Clicking this button will display active VATSIM areas around the world.
|
||||||||||
 |
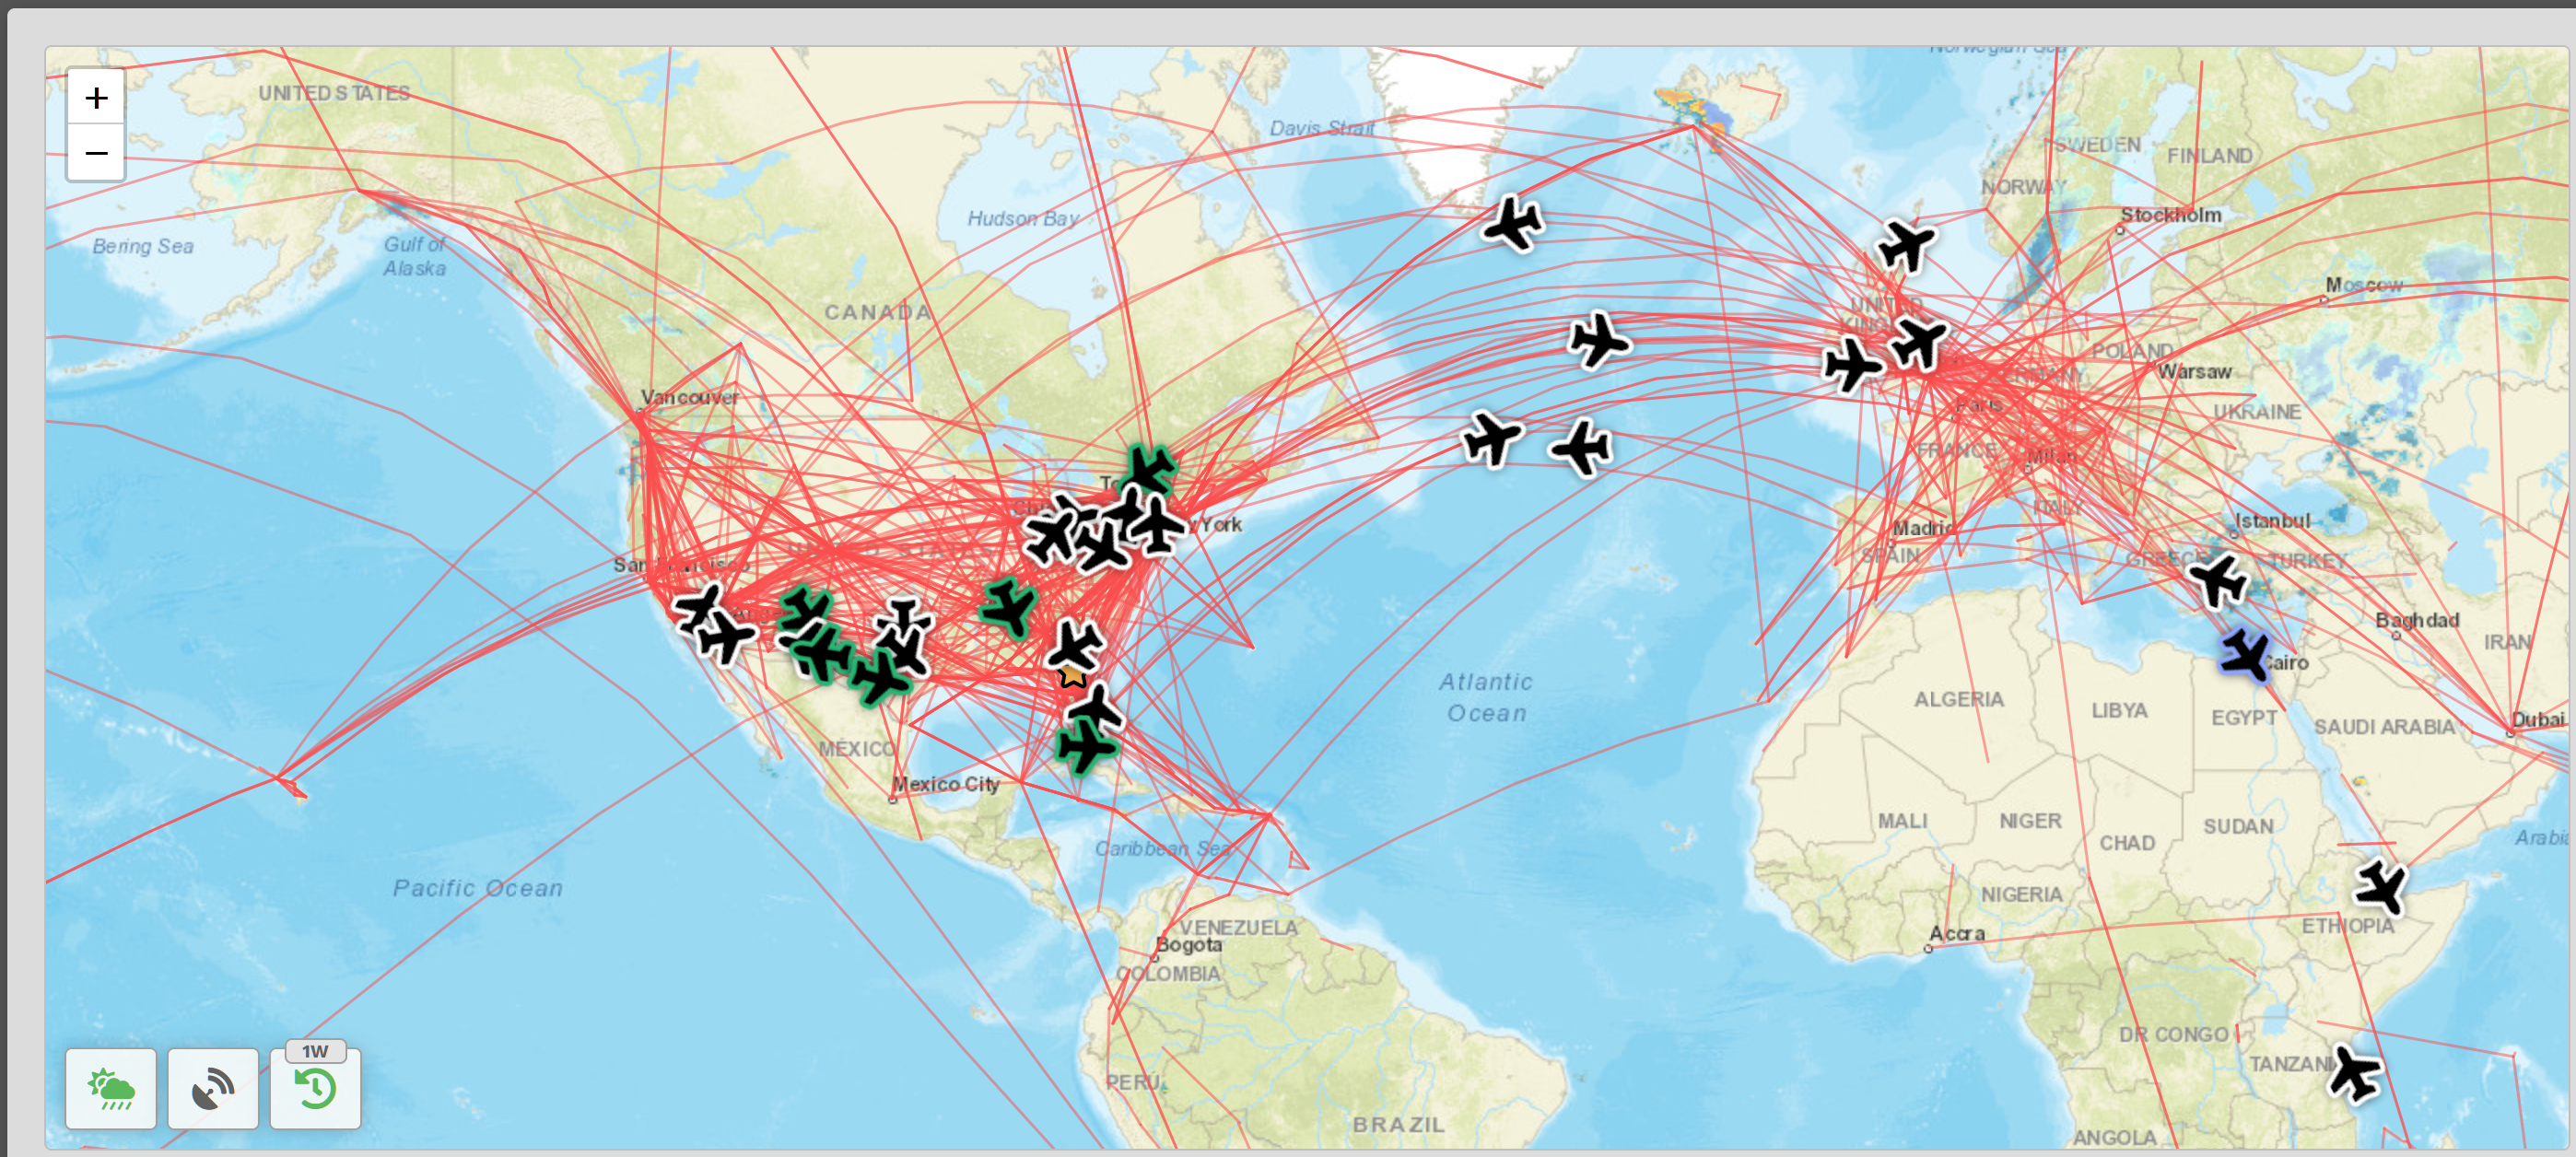
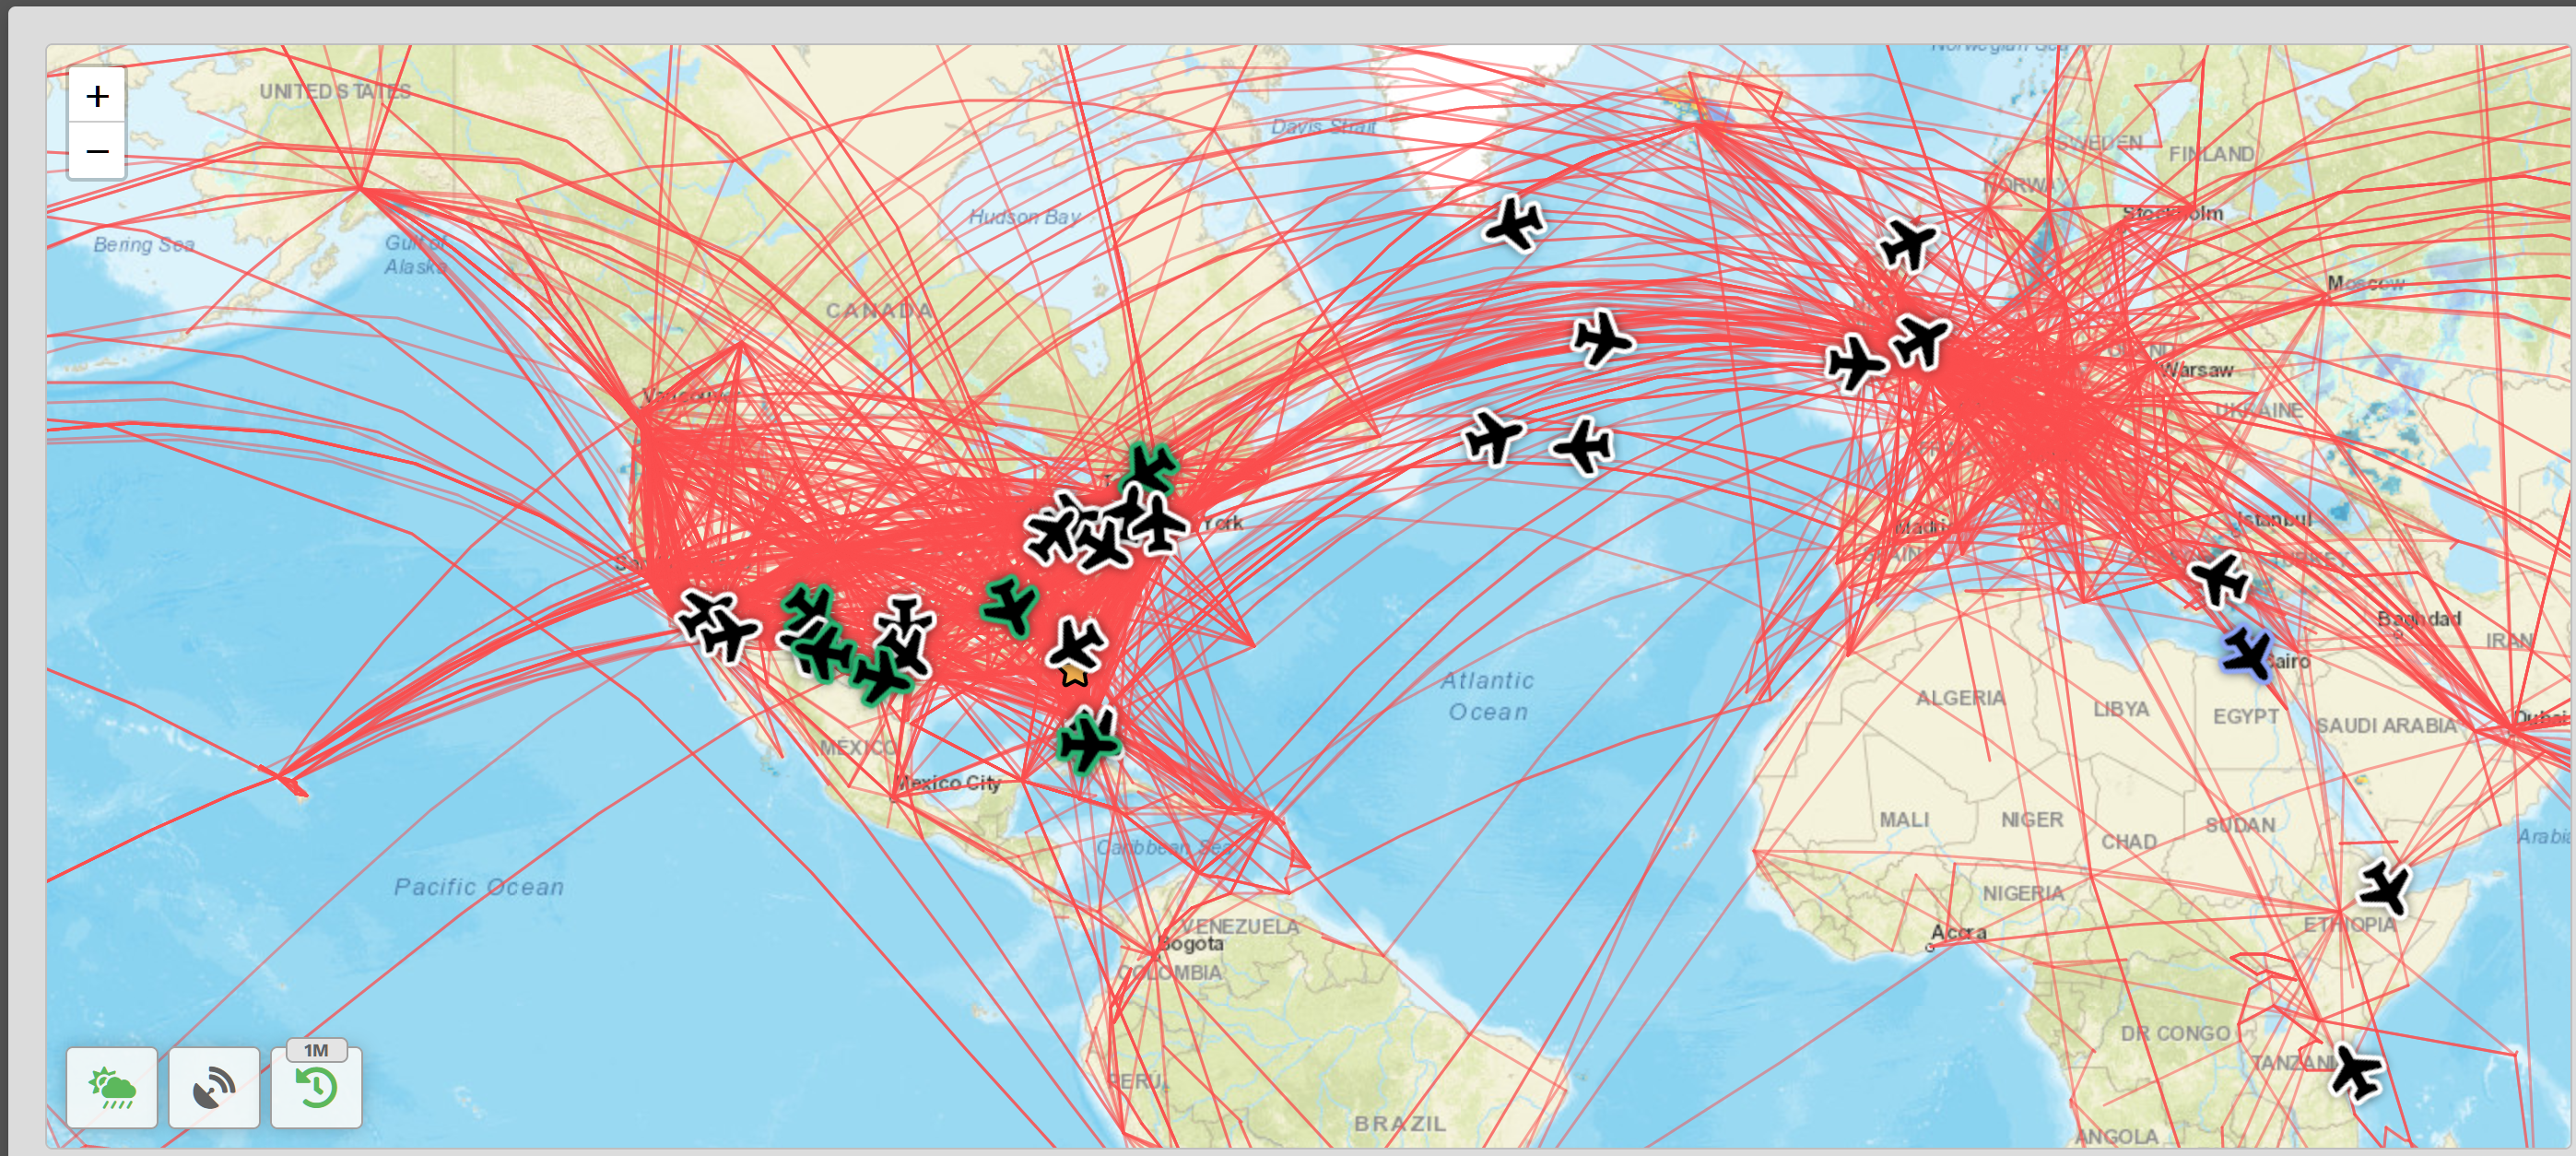
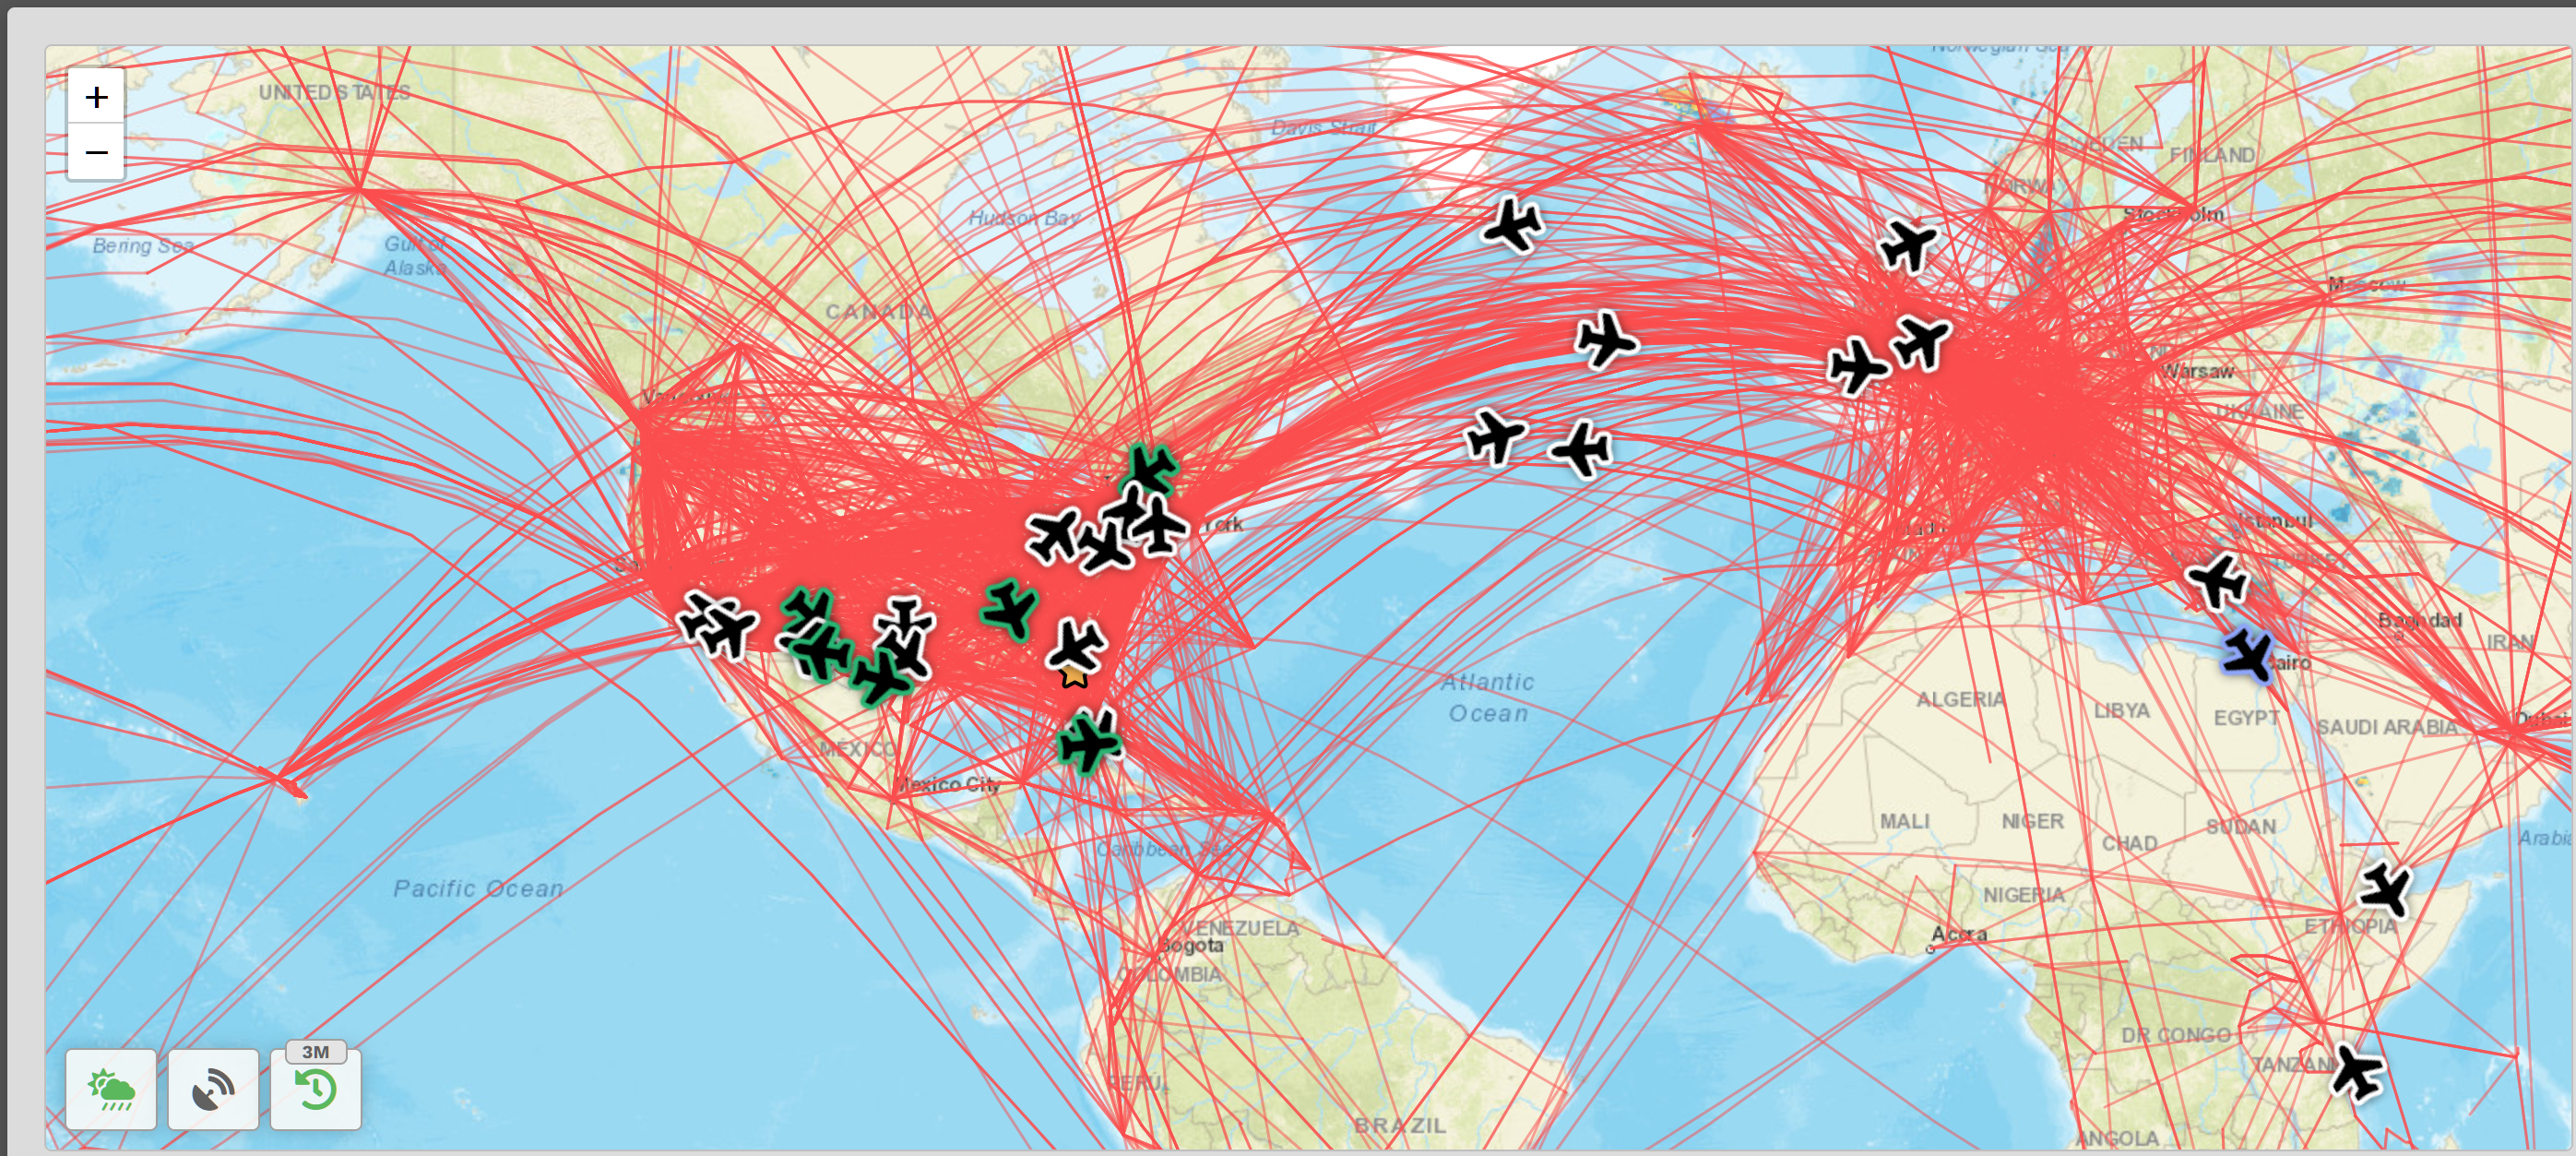
Clicking this button will visibly show the airline’s flight history for various time periods – a single day, a week, a month and three (3) months.
NOTE 1: When this feature is activated, the button will be green.
|
Hover your cursor over a variety of entries on your screen to see even more detail about each flight.
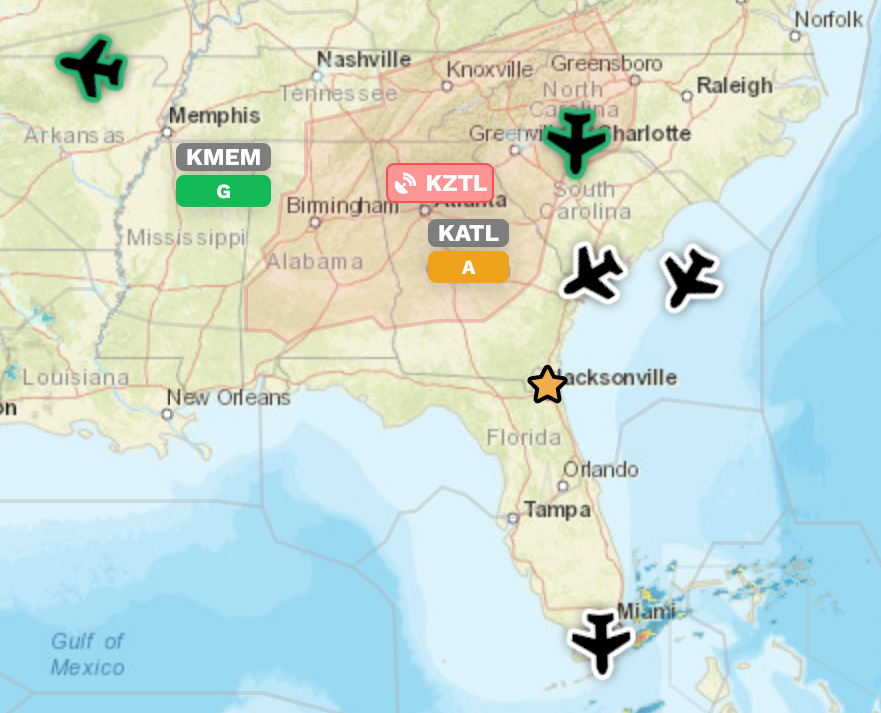
And finally, here are two (2) additional icons you'll encounter on the Map:
|
|
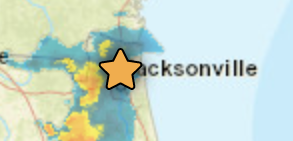
This Star indicates the location of the Company's Headquarters – KJAX | Jacksonville International Airport. |
|
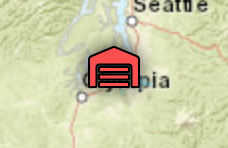
This Hanger indicates the location of your Home. |
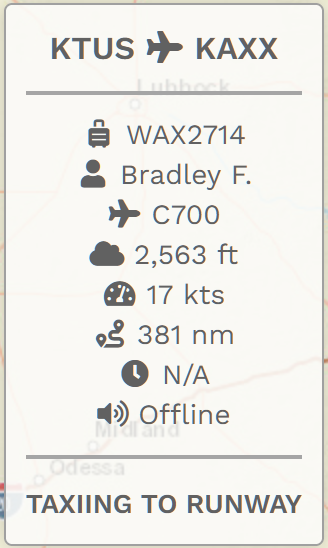
Now, let's examine a line entry to illustrate some of this...

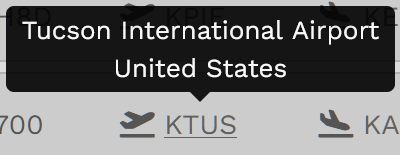
In our example, the Pilot, Flight Student Bradley Fox, is operating Charter flight number 2714. They're flying a Cessna Citation Longitude from KTUS to KAXX. They're currently at 2,559 feet (the field elevation) and taxiing to the runway. Their current speed is 17 kts. The distance remaining to KAXX is 381 nm; the time remaining until their arrival is N/A (0:00).
NOTE: Once the aircraft has taken off, these data points will be updated automatically throughout the flight at regular intervals.
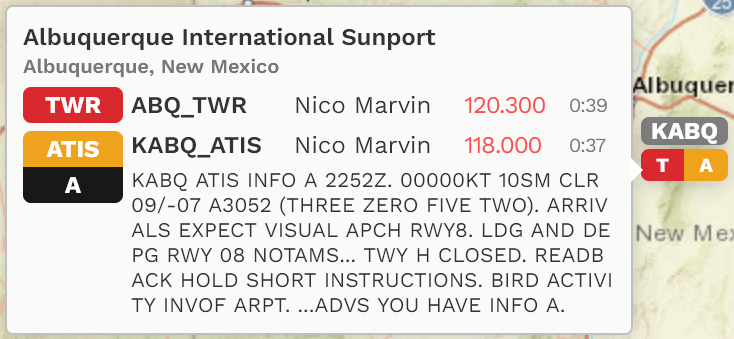
| Hovering your cursor over the aircraft's ICAO Code will reveal its type. | Hovering your cursor over the Departure Airport's ICAO Code will reveal its identity. |
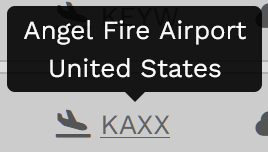
Hovering your cursor over the Arrival Airport's ICAO Code will reveal its identity. |
|
|
|
|

Returning to the Map, locate the aircraft icon and click on it. Zoom in to see this Pilot's planned flight route. Flight data is updated in real time, so you'll note some of the entries have changed from what was seen in the line entry.
Area 3 – Recently Completed Flights
Area 3 displays a list of the fifty (50) most recently-completed flights and their final status – Completed (Green), Diverted (Yellow) or Rejected (Red).
Your double hours and points awarded for participating in an Event flight will not be reflected in this table.
Those bonus hours and points are only visible in the individual PIREP report.
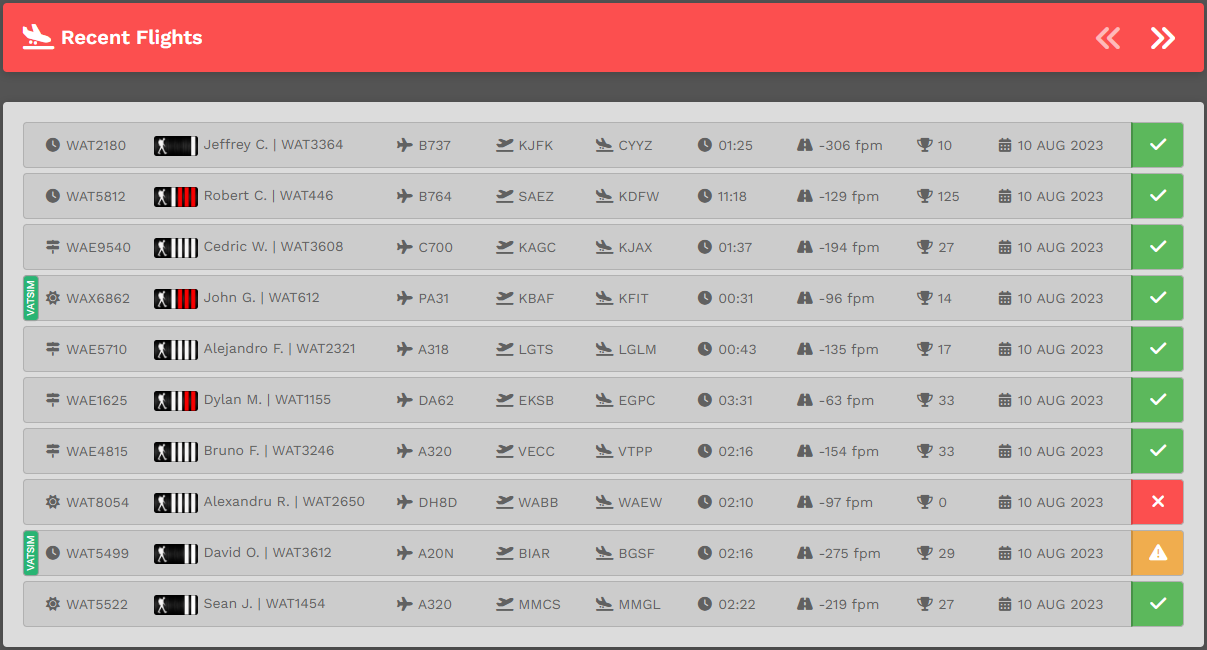
| AREA FEATURE Nº 1: | AREA FEATURE Nº 2: | AREA FEATURE Nº 3: | AREA FEATURE Nº 4: |
| View the details of a particular flight by clicking on its flight number in the Flight column. | Review a Pilot’s Profile by clicking on the Pilot’s name in the Pilot column. | See additional detail about a number of items by hovering your cursor over them. | See the PIREP (Pilot Report) for a flight by clicking on its Flight Status indicator (Green Box with Check Mark above). |
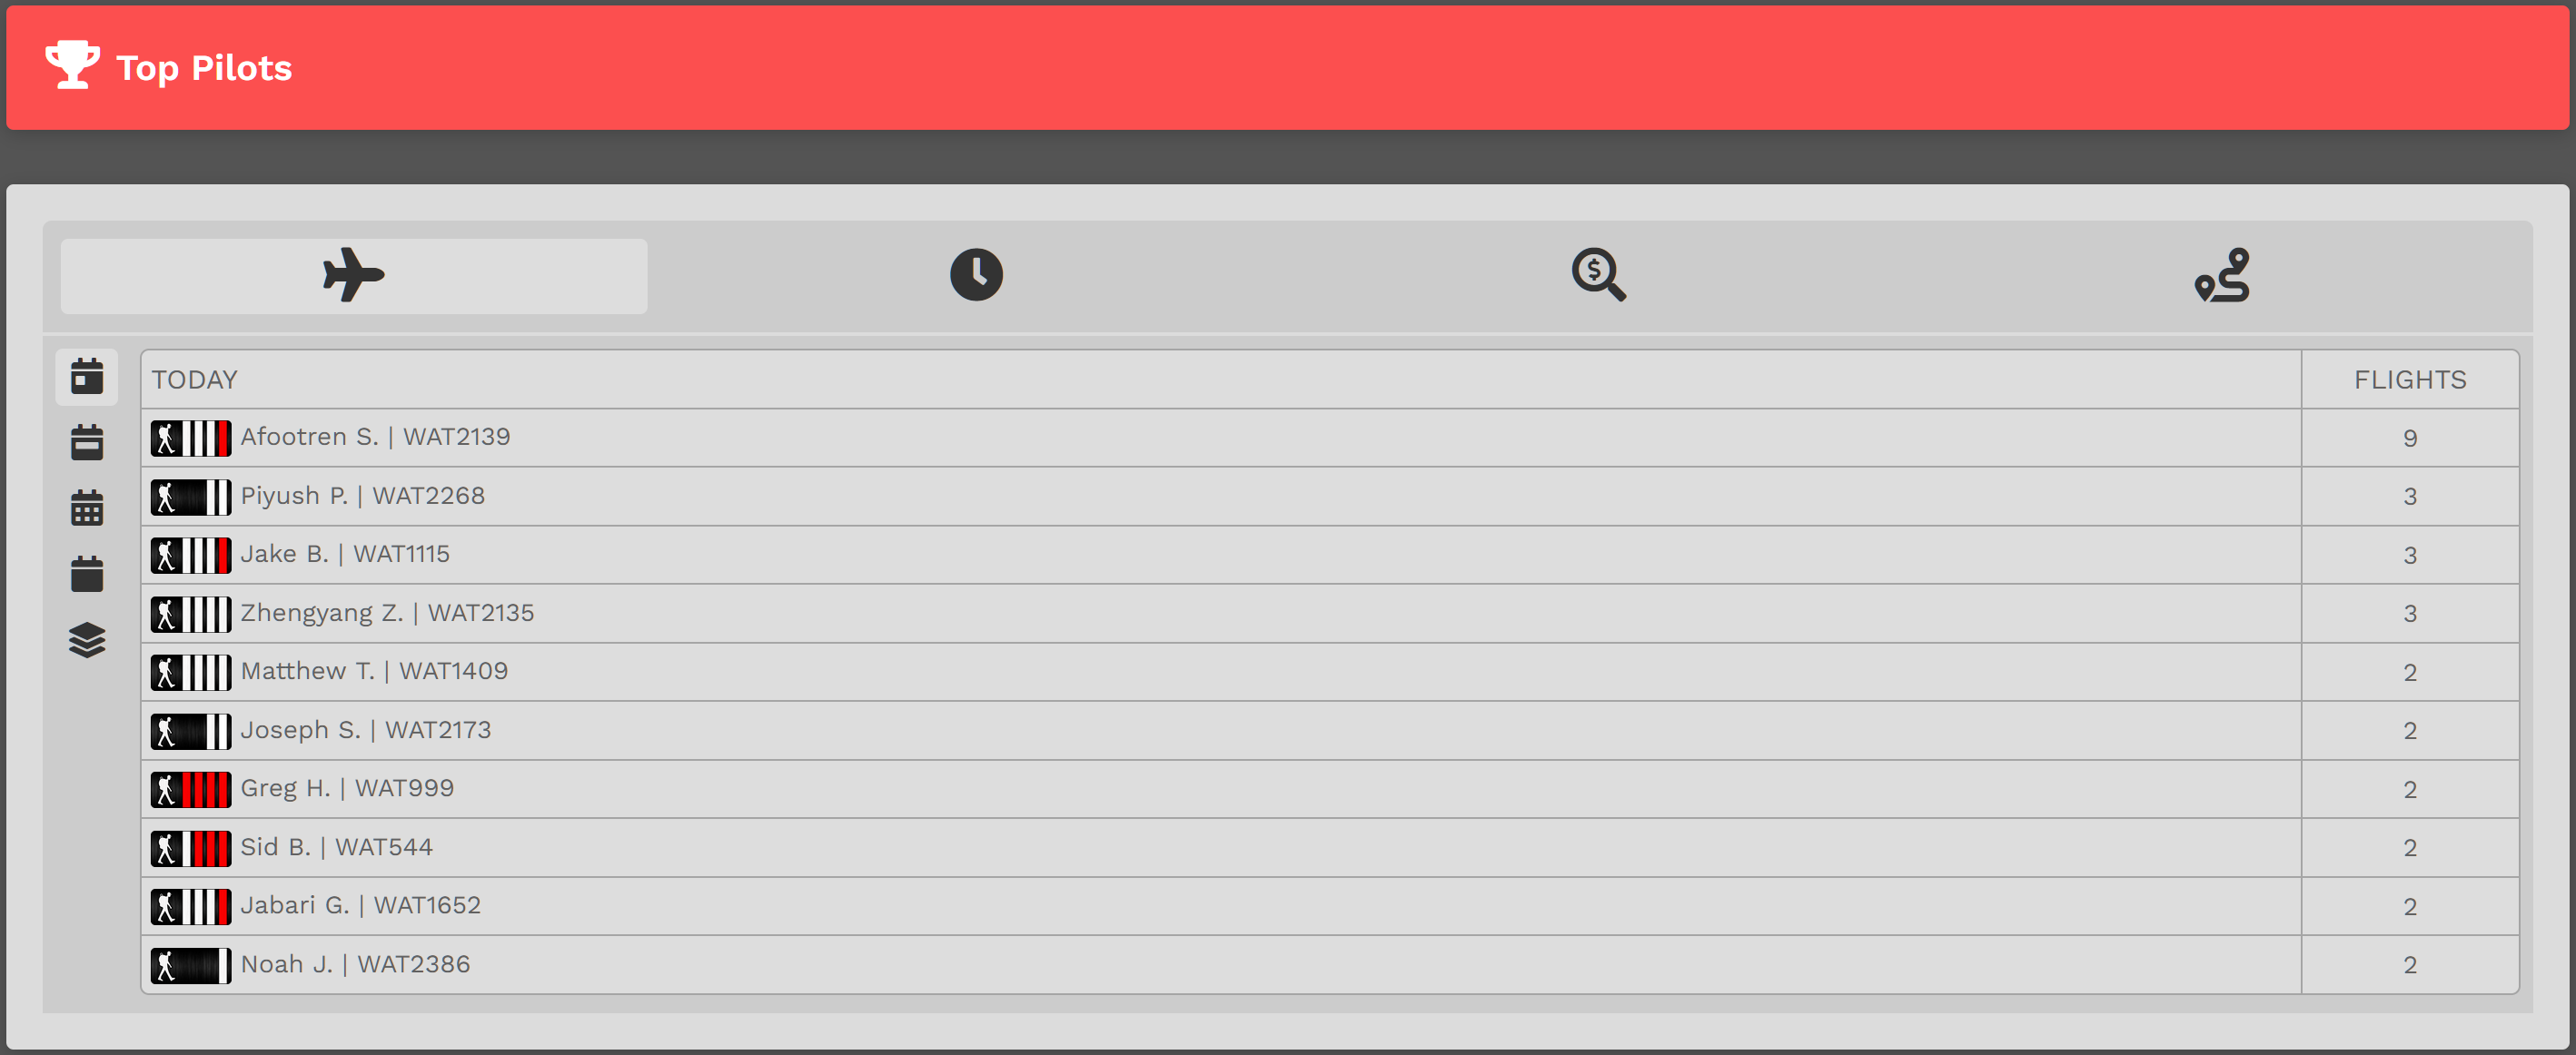
Area 4 – Top Pilots
Area 4 displays performance data for our Top Pilots in four (4) categories: Number of Flights; Hours; Revenues; and Distance. To view the data, click an icon across the top of the display area.

Data is available for the following periods of time: Today; This Week; This Month; This Year; and All Time. To view the data, click an icon to the left of the display area.
![]()
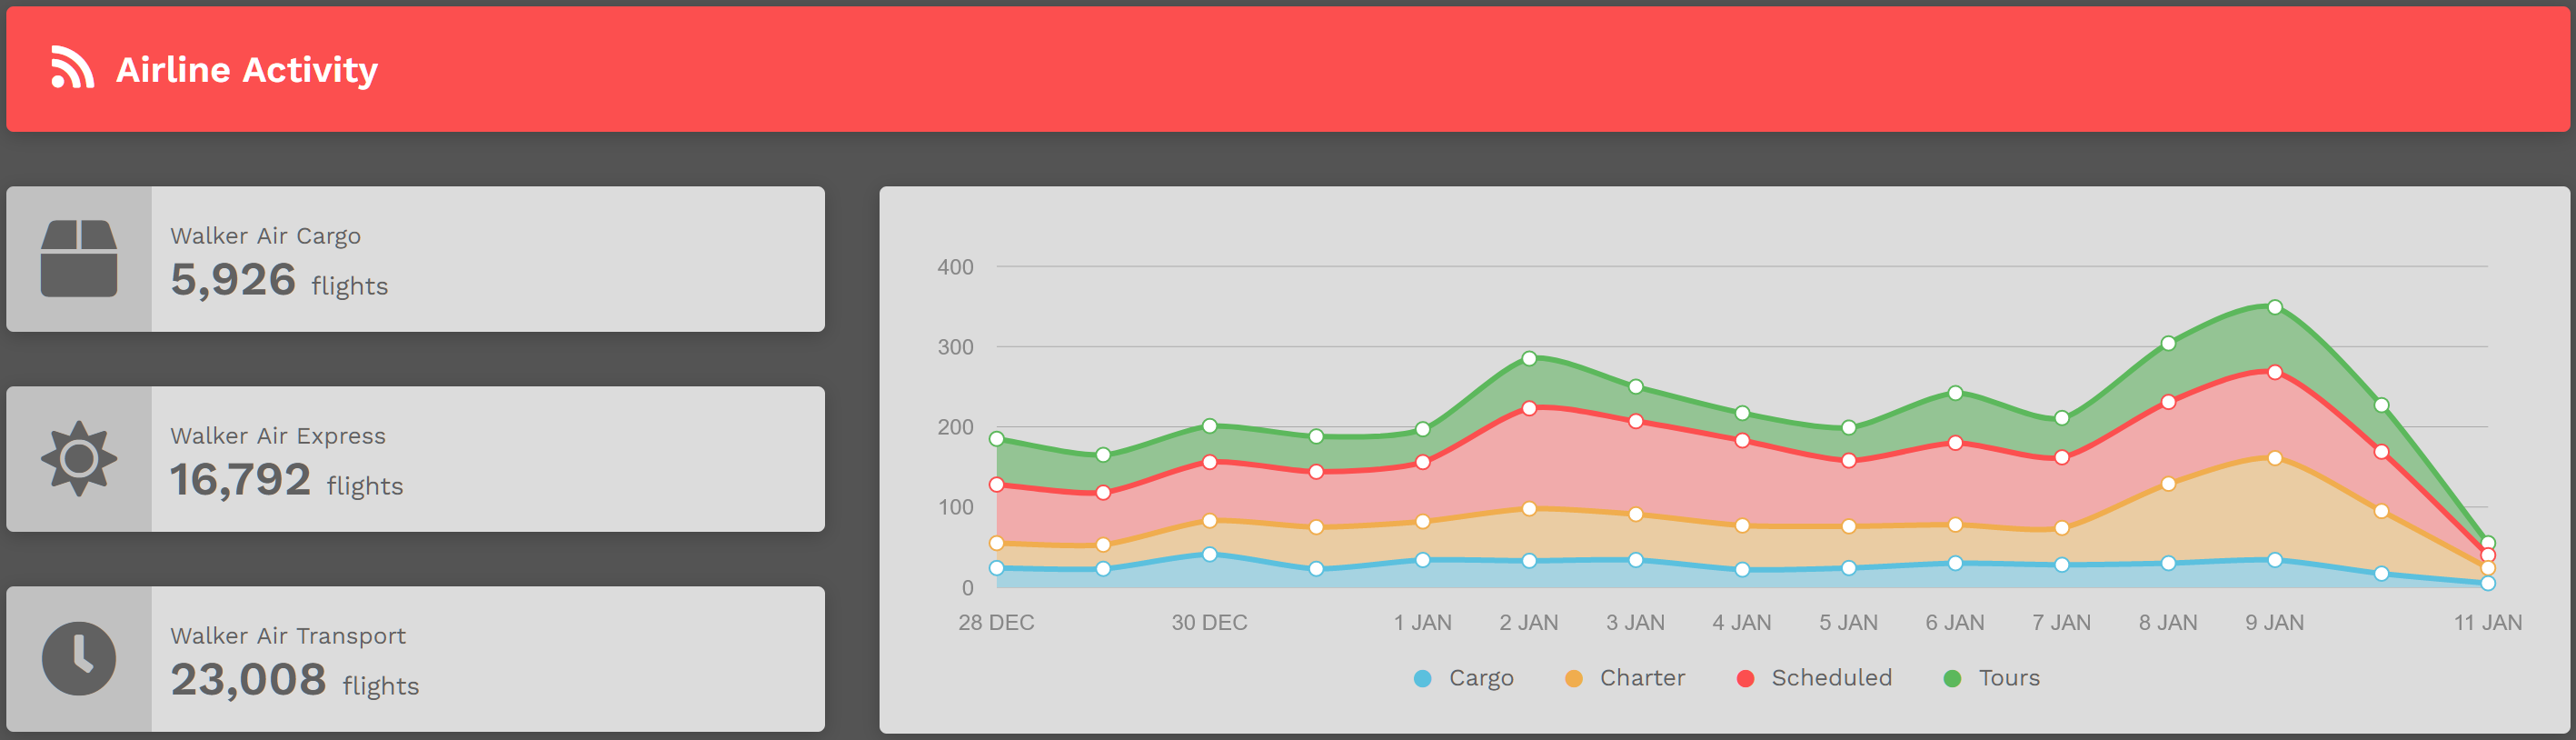
Area 5 – Historical Performance
Area 5 displays current and historical information related to the company’s activity. By placing your cursor over any date, the Total Flights metric displayed in Section 1 is broken down to show the totals for each of the company’s divisions – Cargo (Walker Air Cargo), Charter (Walker Air Charter) and Scheduled (Walker Air Transport). Day-by-day flight activity is graphically displayed on a rolling two (2) week basis. These figures are updated in real time throughout the day.
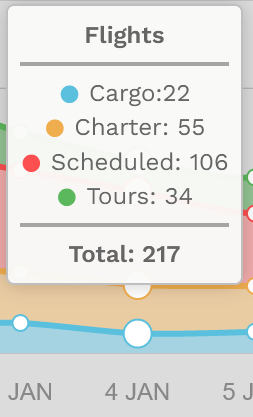
Hover your cursor over a specific day in the line chart to see its color-coded details. The example below shows flight activity for 4 January.
Freely explore this page and its many sections by clicking anything and everything you see. To reset the page to its normal state, click the HOME button or refresh the page.