The Main Screen
The lower section of the Home Page – the Main Screen – is divided into five [5] separate Areas. They’re identified below as follows:
| Area 1 | Area 2 | Area 3 | Area 4 | Area 5 |
| Flight Activity | World Map | Recently-Completed Flights | Top Pilots | Historical Performance |
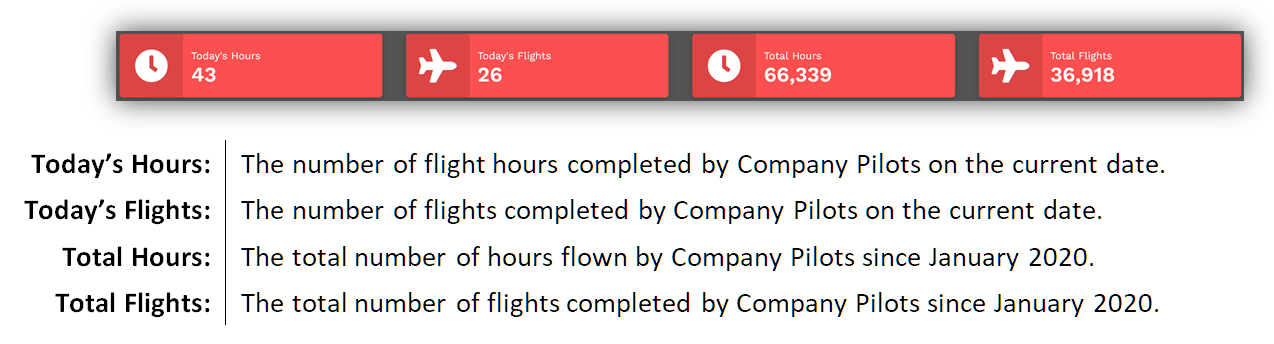
Area 1 – Flight Activity
Area 1 displays information related to the Company’s Flight Activity. These figures are updated in real time throughout the day.
Area 2 – World Map
Area 2 displays a world map showing all flights currently being flown by company Pilots.
The colored dots represent the locations of the Airline’s Hubs.
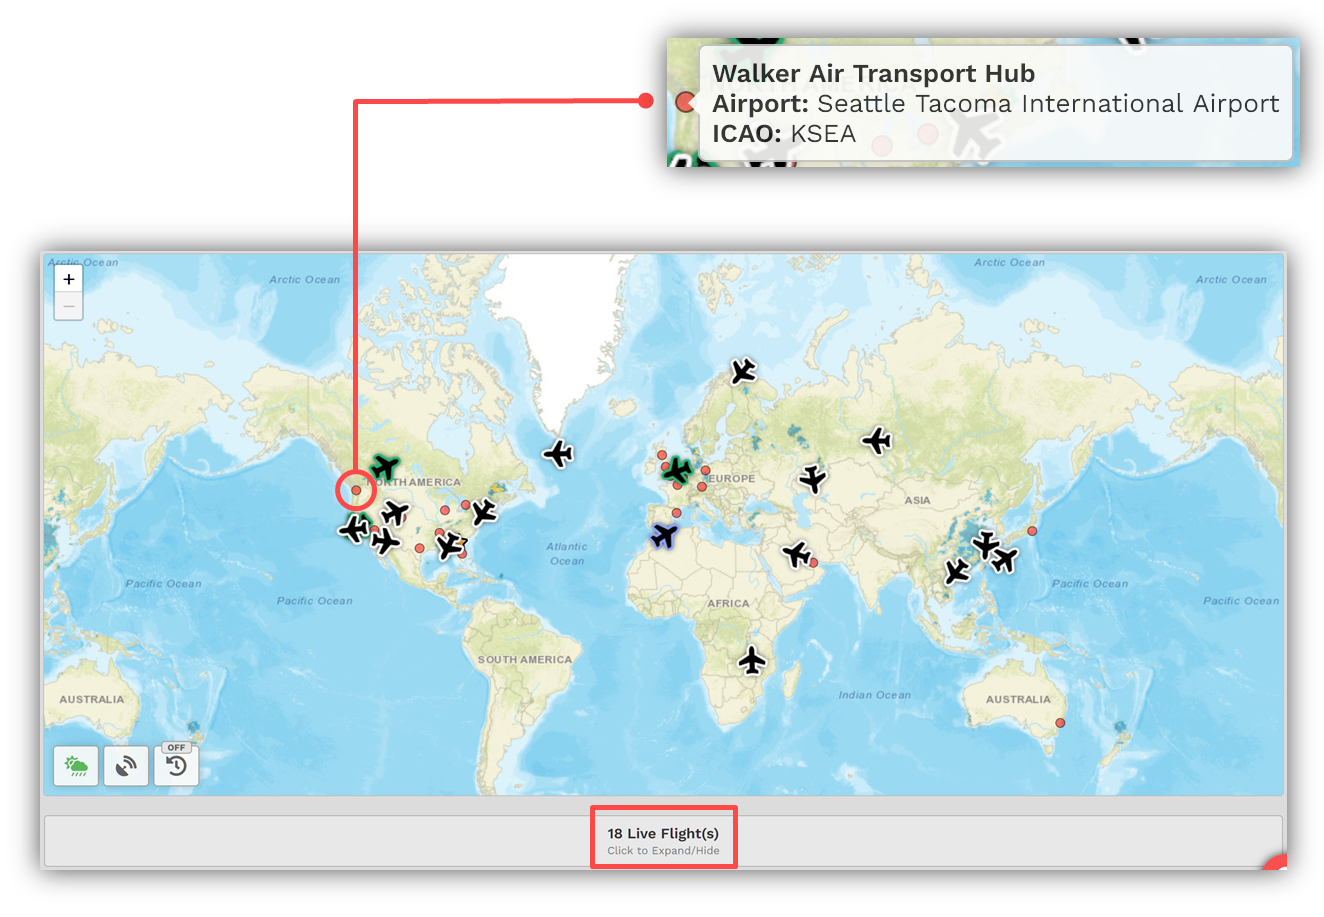
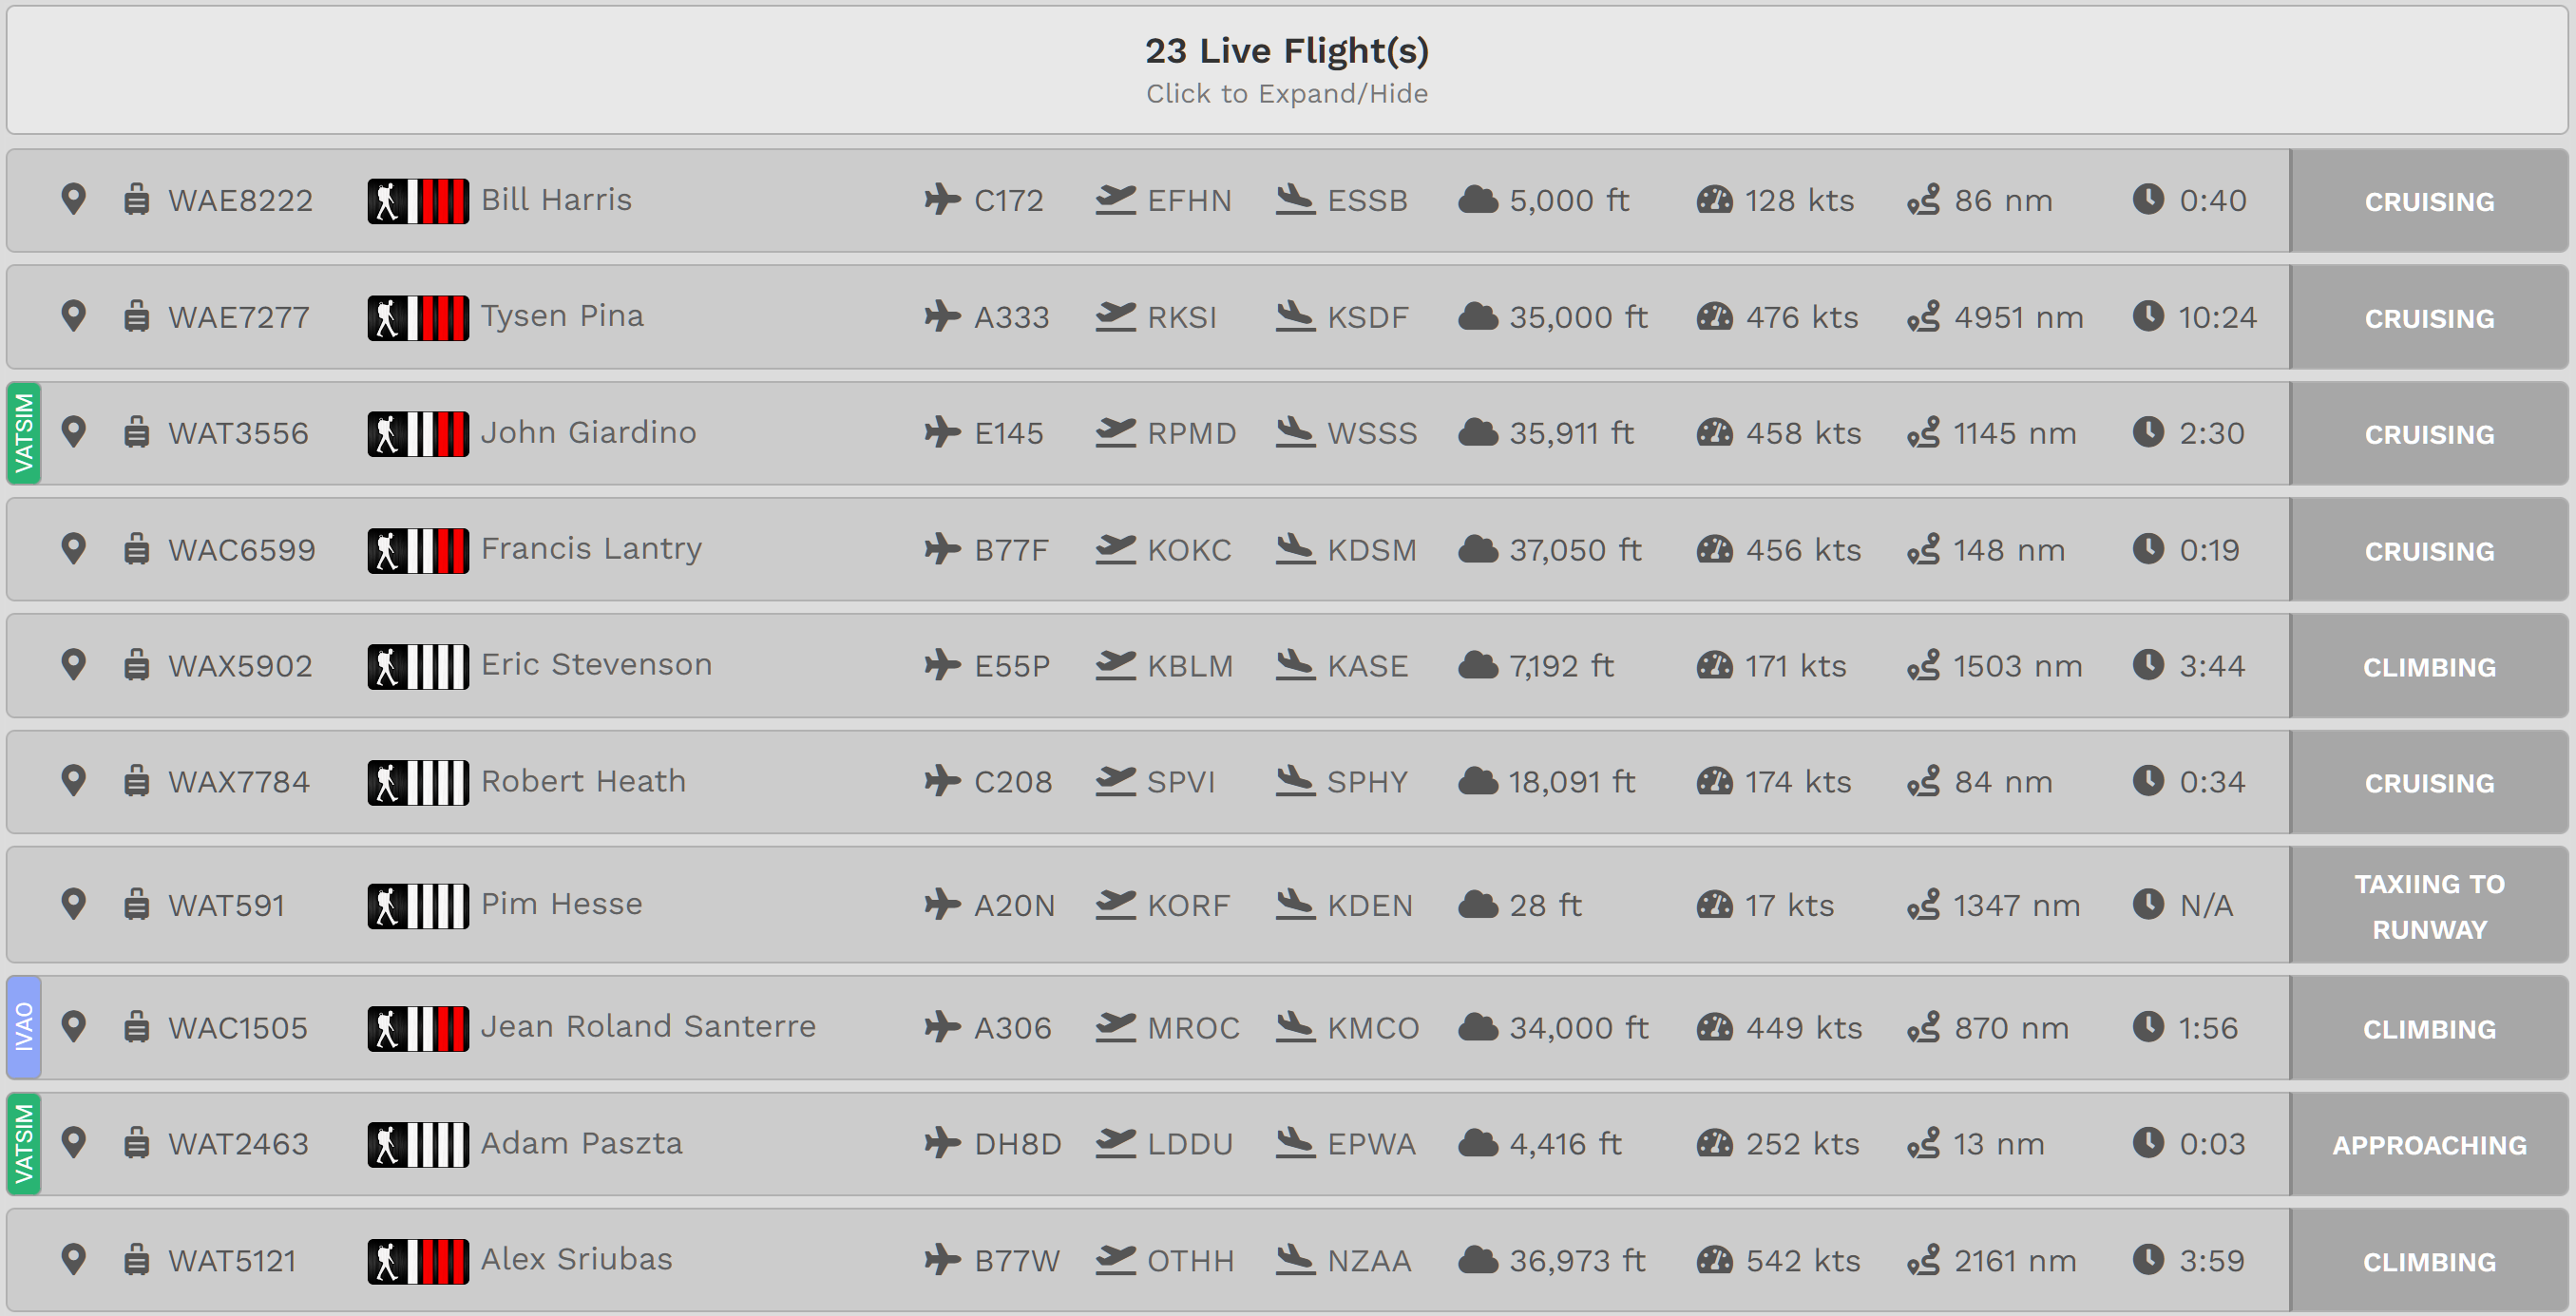
Click Live Flights [red box in the image above] and the screen below will appear. Click it again and the screen will disappear. Once expanded, the status of each flight can be seen in detail [red box in the image below].
Hover your cursor over a variety of entries on your screen to see even more detail about each flight.

Let's examine a line entry to illustrate this...
In our example below, our Pilot, Captain Eric Stevenson, is operating Charter flight number 5902. He's flying an Embraer Phenom 300 from KBLM to KASE. He's currently at 10,620 feet and climbing. His current speed is 134 kts. The distance remaining to KASE is 1,501 nm; the time remaining until his arrival is 3:44.

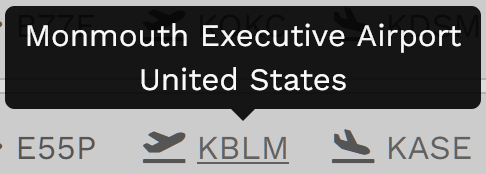
| Hovering your cursor over the aircraft's ICAO Code will reveal its identity. | Hovering your cursor over the Departure Airport's ICAO Code will reveal its identity. |
Hovering your cursor over the Arrival Airport's ICAO Code will reveal its identity. |
 |
 |
 |
Returning to the Map, locate the aircraft icon and click on it. Zoom in to see this Pilot's planned flight route. Flight data is updated in real time, so you'll note some of the entries have changed from what was seen in the line entry.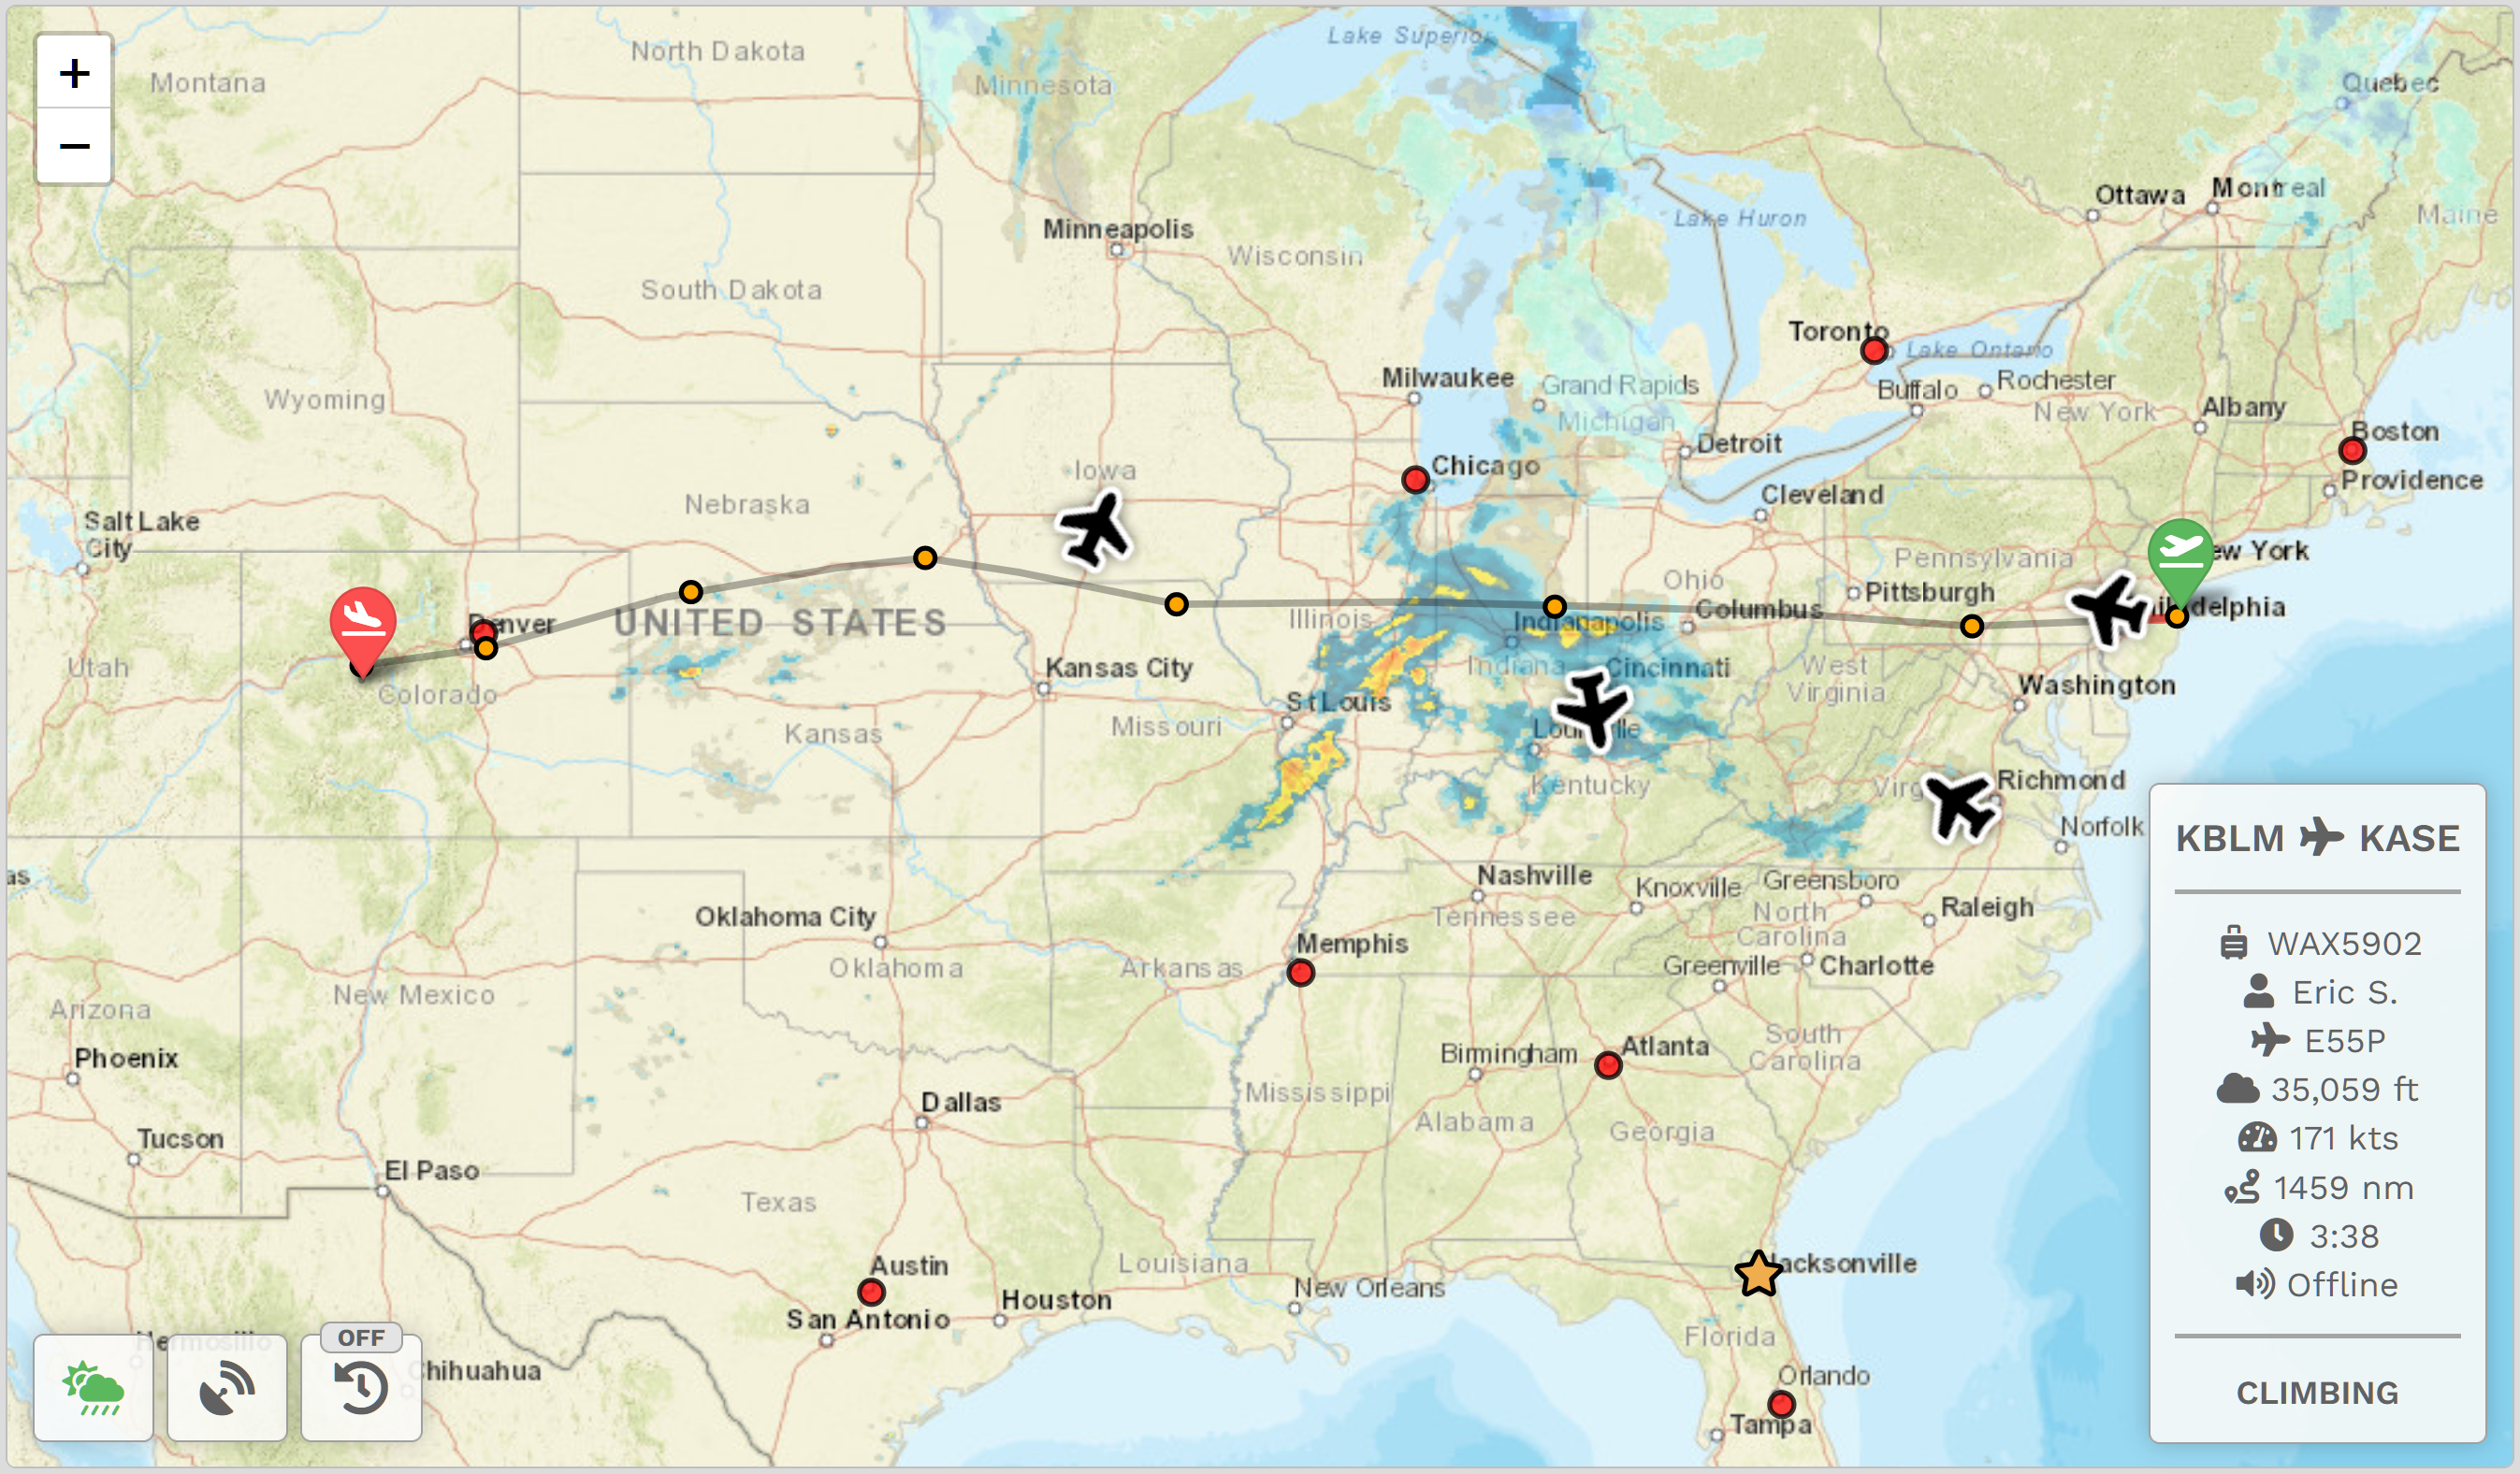

Clicking on a Pilot’s name in that area will take you to their Pilot Profile.
For some flights, you may notice a colored bar on the far left of its line entry. Their meanings are as follows:
| This flight is being/was flown as part of an Event. | This flight is being/was flown on the IVAO ATC Network. | This flight is being/was flown on the PilotEdge ATC Network. | This flight is being/was flown on the VATSIM ATC Network. |
 |
 |
 |
 |
There are three [3] buttons in the lower left corner of the map. Clicking on them will change the information actively displayed.
 |
 |
 |
 |
||||||||||
| Clicking this button will display the weather. | Clicking this button will display VATSIM data. |
Clicking this button will visibly show the airline’s flight history for various time periods – a single day, a week, a month and three [3] months.
In the ‘Off’ position, no data is shown. |
The color of an aircraft icon’s border indicates its current ATC status.
|
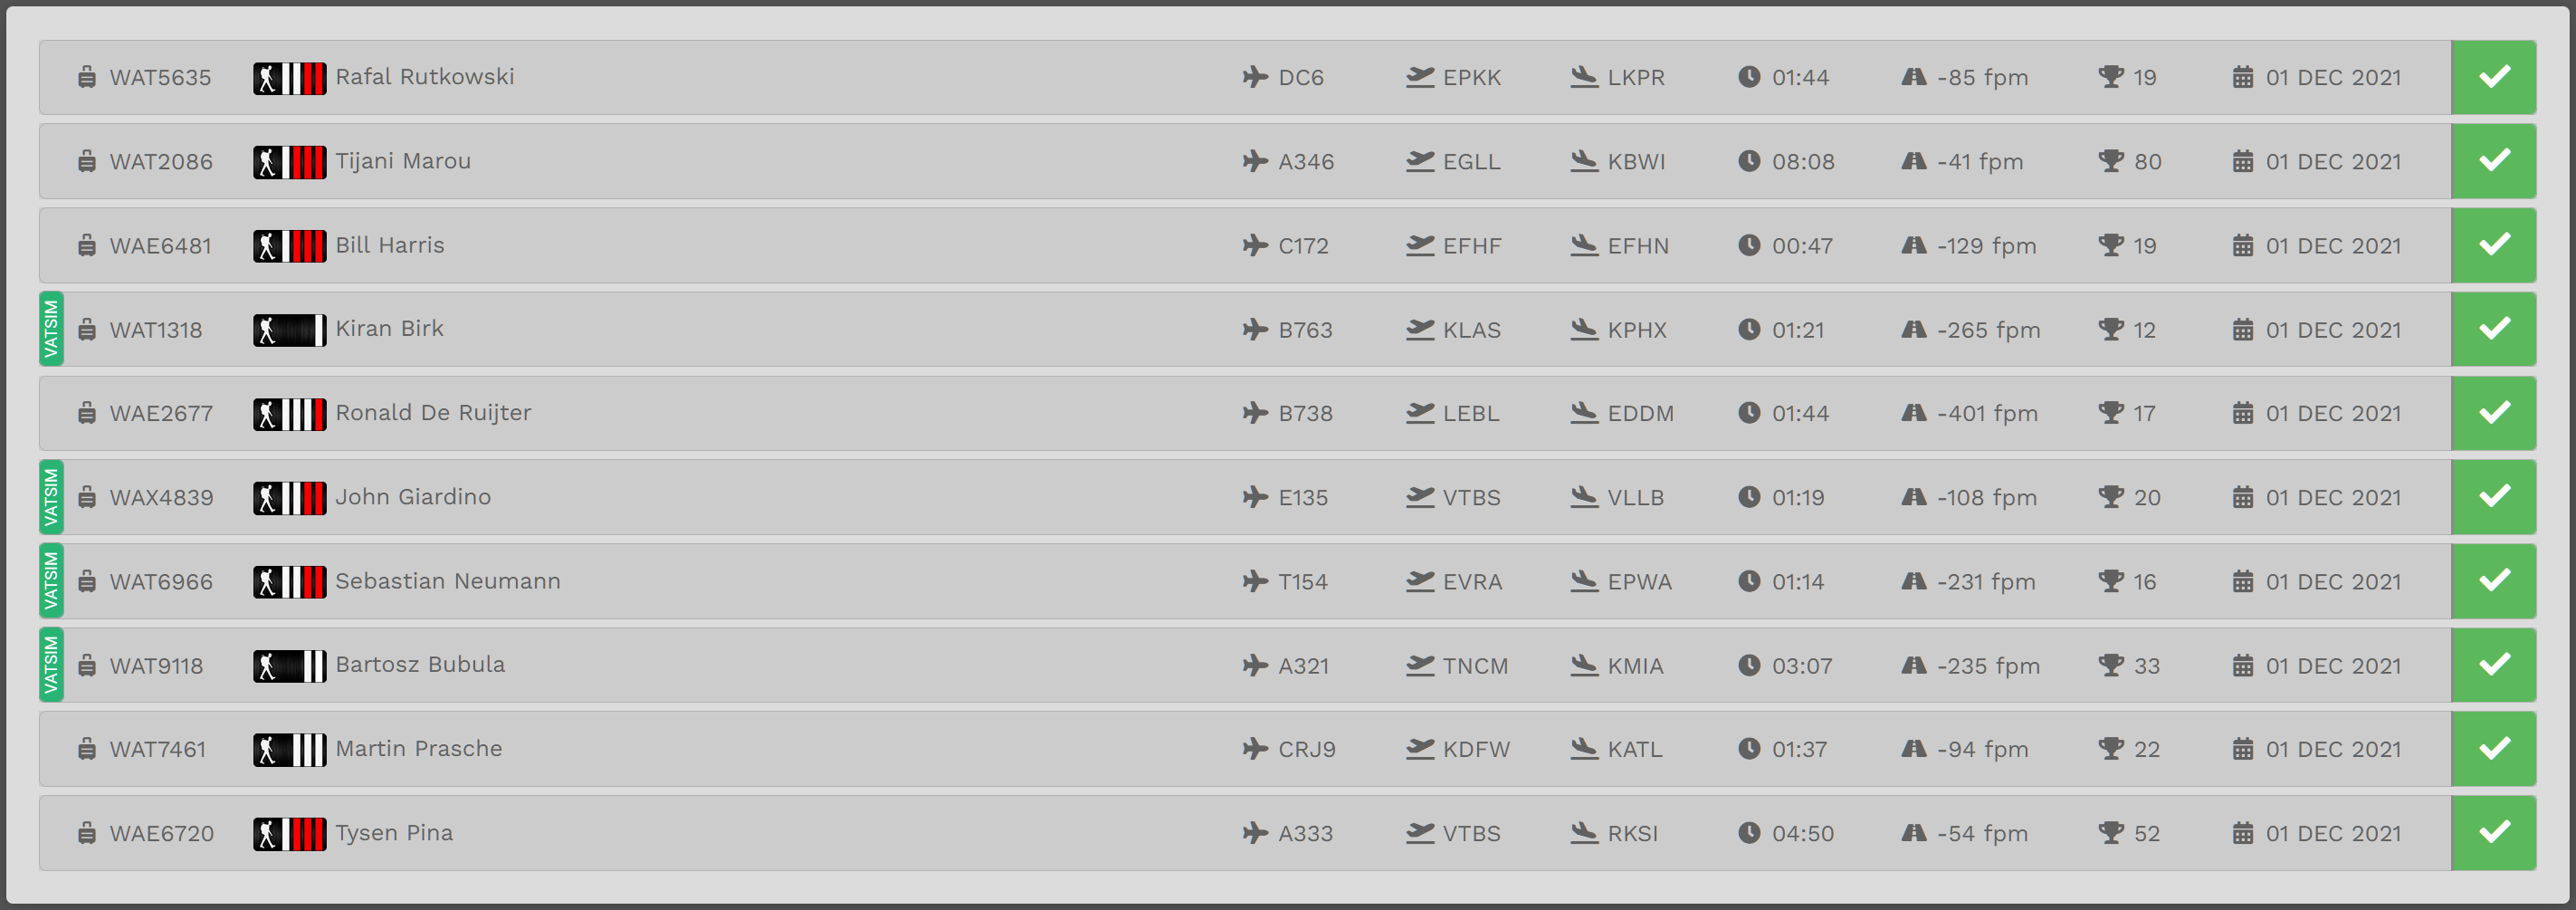
Area 3 – Recently Completed Flights
Area 3 displays a list of the ten (10) most recently-completed flights and their final status – Completed (Green), Diverted (Yellow) or Rejected (Red).
| AREA FEATURE Nº 1: | AREA FEATURE Nº 2: | AREA FEATURE Nº 3: | AREA FEATURE Nº 4: |
| If you wish to view the details of a particular flight, click on its flight number in the Flight column. | If you wish to review a Pilot’s Profile, click on the Pilot’s name in the Pilot column. | Hover your cursor over some items and see additional detail about it. | Click on the Flight Status (Green Box above) and see the PIREP [Pilot Report] for that flight. |
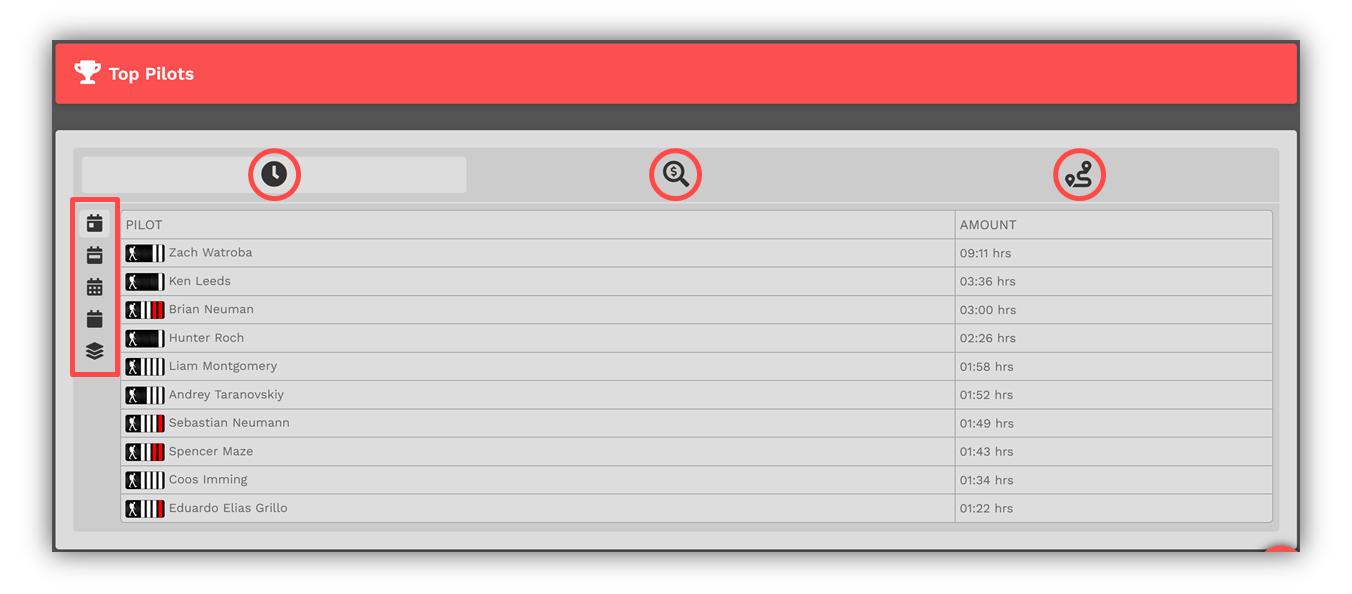
Area 4 – Top Pilots
Area 4 displays information related to the company’s Top Pilots. These figures are updated in real time throughout the day.
 Click through the various Performance Items [top – red circles] and Time Periods [left – red box] to see how our Pilots are performing.
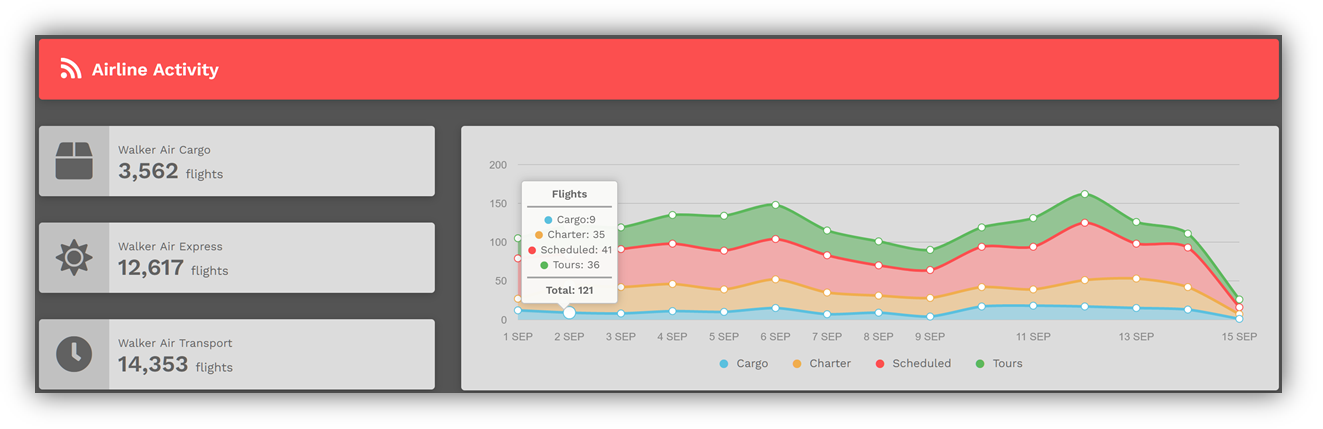
Area 5 – Historical Performance
Area 5 displays current and historical information related to the company’s activity. By placing your cursor over any date, the Total Flights metric displayed in Section 1 is broken down to show the totals for each of the company’s divisions – Cargo (Walker Air Cargo), Charter (Walker Air Express) and Scheduled (Walker Air Transport). Day-by-day flight activity is graphically displayed on a rolling two (2) week basis. These figures are updated in real time throughout the day.
Freely explore this page and its many sections by clicking anything and everything you see. To reset the page to its normal state, click the HOME button or refresh the page.